
The Trump administration is attempting to spur an industrial revival in the United States by imposing tariffs on trading partners. China—a key target of U.S. tariffs—has experienced the largest industrial expansion in history, rising from poverty to become the top global manufacturer and exporter within a generation. Despite the unique nature of its political economy and the challenges it faces, China offers valuable lessons that could benefit the United States as Washington attempts to increase domestic manufacturing. Among them:
- Beijing did not rely on a tariff-based traditional import substitution strategy. China implemented many promotive and restrictive measures to boost domestic investment and production, especially by attracting foreign direct investment (FDI) that facilitated tech transfer and skills upgrading. Tariffs and non-tariff barriers were among its many policy tools and by themselves don't explain China's rapid industrialization.
- China has used long-term plans that offer a degree of predictability. When Beijing says it wants to achieve a given goal, investors listen and respond accordingly.
- China was able to achieve export-oriented growth and investment in the 2000s because its economy was comparatively small. Today, it's the second-largest economy and can no longer rely on exports for sustained growth. For the United States—the world's largest economy—export-oriented growth would be even more infeasible.
- Beijing's export competitiveness isn't based on an undervalued exchange rate. China's market interventions focused on keeping its currency weak for over a decade, but that changed more than 10 years ago. The era of rapidly rising official foreign exchange reserves among emerging markets, especially China, is over. That will make potential exchange rate negotiations between the United States and its trading partners more difficult.
- Beijing is more focused on manufacturing efficiency through automation than jobs, despite China still having far lower manufacturing wages than the United States. New manufacturing in the United States will likely need to be more capital-intensive than labor-intensive if it wants to be competitive.
- Beijing is investing heavily in scientific and innovative research by supporting Chinese research labs, academic institutions, and firms. China is on track to overtake the United States in total R&D spending in purchasing-power terms. R&D spending doesn't necessarily translate into manufacturing output, but this trend doesn't bode well for America's innovation advantage.
China Didn't Rely on Traditional Import Substitution
China's industrial policies are ambitious and use many tools, such as subsidies, tax credits, cheap land, government procurement, localization requirements, and state-linked loans and investments. What's more, the political economy of China's party-state, characterized by centralized planning and direct intervention that allows it to strategically guide industries and the financial sector, cannot be replicated by other countries lacking similar governance structures and institutional capacities.
China's industrial policies are ambitious and use many tools. What's more, the political economy of China's party-state cannot be replicated by other countries lacking similar governance structures and institutional capacities.
China's approach to industrial upgrading over the past two decades has been far more elaborate than traditional import substitution strategies that rely on tariffs and non-tariff barriers to allow domestic firms to expand in a protected market. Beijing has used such measures, albeit carefully.
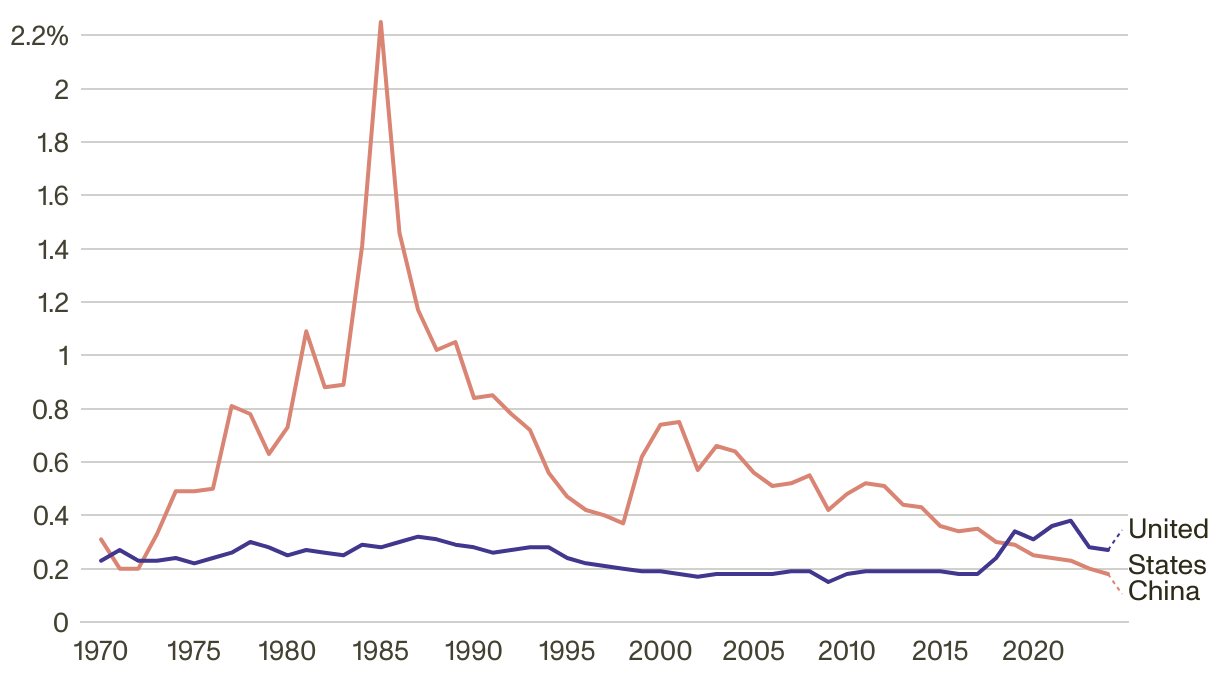
Although achieving self-sufficiency has been gaining importance and pace, Chinese planners understand which products and technologies China has the capability to produce domestically and which ones it must import from abroad. What cannot be made domestically can be imported, and/or stockpiled, until “indigenous innovation (PDF)” measures allow Chinese firms to develop substitutes. Chinese policymakers have avoided harming export competitiveness by raising the costs of imported inputs. China's tariff burdens have fallen over the past 20 years (Figure 1), and earlier higher rates reflected China's underdeveloped tax system more than its industrial strategy.
Figure 1: Tariff Revenue as a Share of GDP Is Now Higher for the United States than for China
Customs Duties as a Share of GDP
| Year | China | United States |
|---|---|---|
| 1970 | 0.31% | 0.23% |
| 1971 | 0.20% | 0.27% |
| 1972 | 0.20% | 0.23% |
| 1973 | 0.33% | 0.23% |
| 1974 | 0.49% | 0.24% |
| 1975 | 0.49% | 0.22% |
| 1976 | 0.50% | 0.24% |
| 1977 | 0.81% | 0.26% |
| 1978 | 0.78% | 0.30% |
| 1979 | 0.63% | 0.28% |
| 1980 | 0.73% | 0.25% |
| 1981 | 1.09% | 0.27% |
| 1982 | 0.88% | 0.26% |
| 1983 | 0.89% | 0.25% |
| 1984 | 1.41% | 0.29% |
| 1985 | 2.25% | 0.28% |
| 1986 | 1.46% | 0.30% |
| 1987 | 1.17% | 0.32% |
| 1988 | 1.02% | 0.31% |
| 1989 | 1.05% | 0.29% |
| 1990 | 0.84% | 0.28% |
| 1991 | 0.85% | 0.26% |
| 1992 | 0.78% | 0.27% |
| 1993 | 0.72% | 0.28% |
| 1994 | 0.56% | 0.28% |
| 1995 | 0.47% | 0.24% |
| 1996 | 0.42% | 0.22% |
| 1997 | 0.40% | 0.21% |
| 1998 | 0.37% | 0.20% |
| 1999 | 0.62% | 0.19% |
| 2000 | 0.74% | 0.19% |
| 2001 | 0.75% | 0.18% |
| 2002 | 0.57% | 0.17% |
| 2003 | 0.66% | 0.18% |
| 2004 | 0.64% | 0.18% |
| 2005 | 0.56% | 0.18% |
| 2006 | 0.51% | 0.18% |
| 2007 | 0.52% | 0.19% |
| 2008 | 0.55% | 0.19% |
| 2009 | 0.42% | 0.15% |
| 2010 | 0.48% | 0.18% |
| 2011 | 0.52% | 0.19% |
| 2012 | 0.51% | 0.19% |
| 2013 | 0.44% | 0.19% |
| 2014 | 0.43% | 0.19% |
| 2015 | 0.36% | 0.19% |
| 2016 | 0.34% | 0.18% |
| 2017 | 0.35% | 0.18% |
| 2018 | 0.30% | 0.24% |
| 2019 | 0.29% | 0.34% |
| 2020 | 0.25% | 0.31% |
| 2021 | 0.24% | 0.36% |
| 2022 | 0.23% | 0.38% |
| 2023 | 0.20% | 0.28% |
| 2024 | 0.18% | 0.27% |
Sources: Bureau of Economic Analysis (United States), Bureau of the Fiscal Service (United States), National Bureau of Statistics (China), and Ministry of Finance (China) via CEIC.
China relied heavily on foreign direct investment to develop its manufacturing sector, especially for exports. China's openness to FDI distinguishes it from other economies that adopted a version of the “East Asian development model.” China welcomed investment from advanced economies and encouraged (or, in some sectors, required) joint ventures that enabled technology transfer and skills upgrading. China's reliance on FDI peaked in the 1990s and 2000s as a share of its total investment, but FDI is still important for priority industries, especially in high-tech sectors. Foreign-funded enterprises dominated China's export growth in the 2000s, but since the 2010s, private Chinese manufacturing firms have taken over (Figure 2), reflecting at least partial success of Beijing's “indigenous innovation” strategy.
Figure 2: Foreign Firms Led China's Export Growth in the 2000s, Then Domestic Firms Took Over
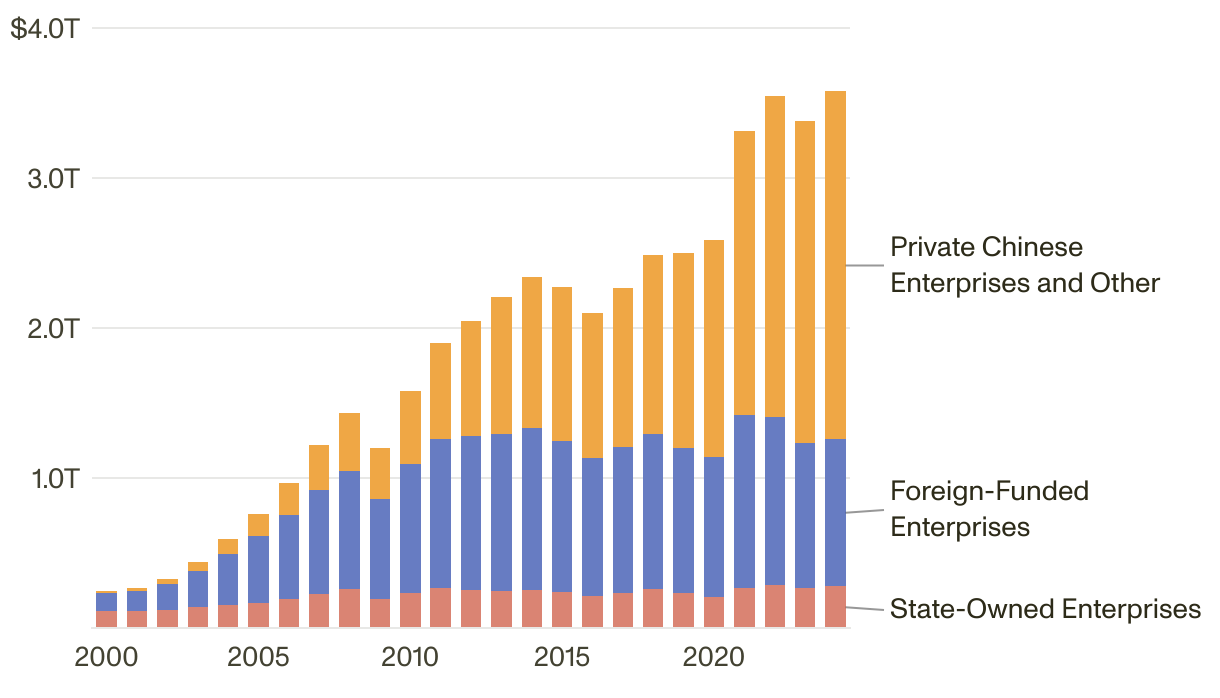
In U.S. Dollars (Trillion)
| Year | 2000 | 2001 | 2002 | 2003 | 2004 | 2005 | 2006 | 2007 | 2008 | 2009 | 2010 | 2011 | 2012 | 2013 | 2014 | 2015 | 2016 | 2017 | 2018 | 2019 | 2020 | 2021 | 2022 | 2023 | 2024 |
|---|---|---|---|---|---|---|---|---|---|---|---|---|---|---|---|---|---|---|---|---|---|---|---|---|---|
| State-Owned Enterprises | 0.116 | 0.113 | 0.123 | 0.138 | 0.154 | 0.169 | 0.191 | 0.225 | 0.257 | 0.191 | 0.234 | 0.267 | 0.256 | 0.249 | 0.256 | 0.242 | 0.216 | 0.231 | 0.257 | 0.236 | 0.207 | 0.269 | 0.284 | 0.269 | 0.278 |
| Foreign-Funded Enterprises | 0.119 | 0.133 | 0.170 | 0.240 | 0.339 | 0.444 | 0.564 | 0.696 | 0.791 | 0.672 | 0.862 | 0.995 | 1.023 | 1.044 | 1.075 | 1.005 | 0.917 | 0.978 | 1.036 | 0.966 | 0.932 | 1.153 | 1.123 | 0.966 | 0.979 |
| Private Chinese Enterprises & Other | 0.013 | 0.020 | 0.033 | 0.060 | 0.101 | 0.149 | 0.214 | 0.300 | 0.383 | 0.338 | 0.481 | 0.636 | 0.770 | 0.916 | 1.011 | 1.026 | 0.965 | 1.055 | 1.193 | 1.298 | 1.450 | 1.894 | 2.137 | 2.145 | 2.320 |
Source: General Administration of Customs (China) via CEIC.
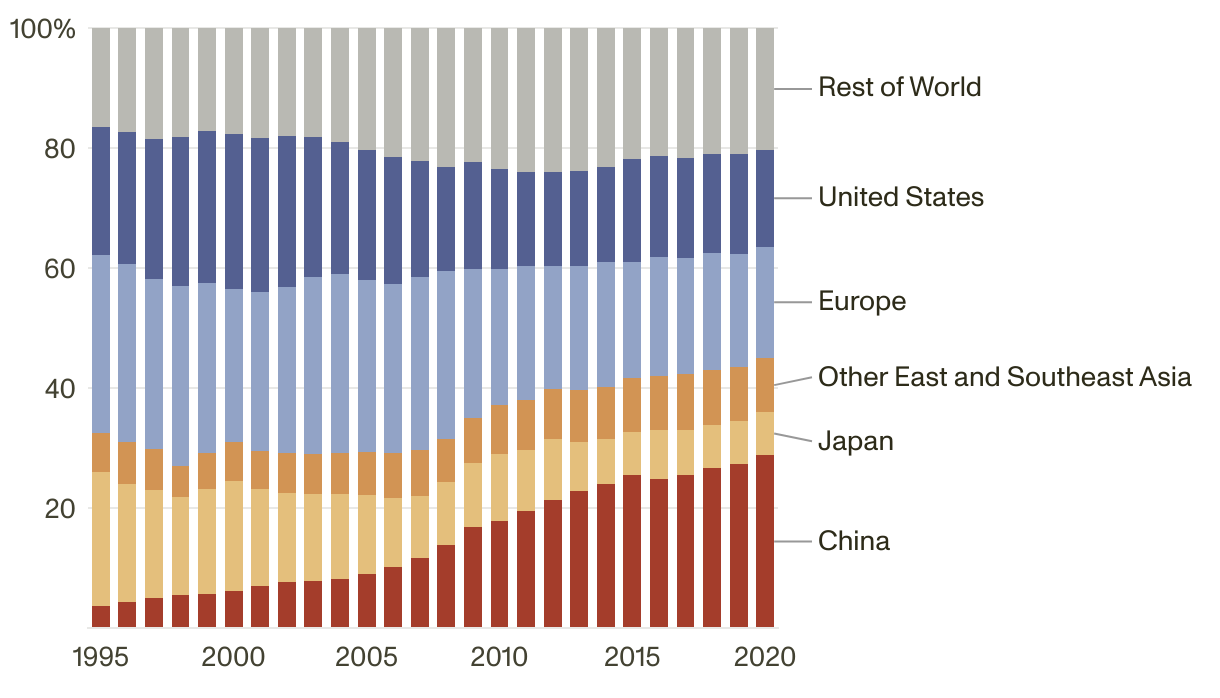
China's all-of-the-above approach to industrial policy and foreign investment, combined with reforms and its growing and competitive internal market, put it on the path to becoming the world's top manufacturer. By 2010, China had overtaken the United States in manufacturing value added (Figure 3). However, the biggest loser in terms of displaced global market share was not the United States but Japan.
Figure 3: China's Rise in Manufacturing Has Displaced Japan More Than the United States
Share of Global Manufacturing Value Added
| Region | 1995 | 1996 | 1997 | 1998 | 1999 | 2000 | 2001 | 2002 | 2003 | 2004 | 2005 | 2006 | 2007 | 2008 | 2009 | 2010 | 2011 | 2012 | 2013 | 2014 | 2015 | 2016 | 2017 | 2018 | 2019 | 2020 | ||||||||||||||||||||||||||
|---|---|---|---|---|---|---|---|---|---|---|---|---|---|---|---|---|---|---|---|---|---|---|---|---|---|---|---|---|---|---|---|---|---|---|---|---|---|---|---|---|---|---|---|---|---|---|---|---|---|---|---|---|
| China | 3.7% | 4.3% | 5.0% | 5.4% | 5.6% | 6.1% | 7.1% | 7.6% | 7.9% | 8.2% | 9.0% | 10.1% | 11.7% | 13.9% | 16.8% | 17.8% | 19.5% | 21.3% | 22.8% | 24.0% | 25.4% | 24.9% | 25.5% | 26.6% | 27.3% | 28.9% | ||||||||||||||||||||||||||
| Japan | 22.3% | 19.6% | 18.1% | 16.5% | 17.6% | 18.4% | 16.2% | 14.8% | 14.5% | 14.1% | 13.1% | 11.5% | 10.4% | 10.4% | 10.6% | 11.1% | 10.2% | 10.2% | 8.1% | 7.5% | 7.3% | 8.1% | 7.5% | 7.3% | 7.2% | 7.1% | ||||||||||||||||||||||||||
| Other East and Southeast Asia | 6.5% | 7.0% | 6.8% | 5.1% | 5.9% | 6.4% | 6.3% | 6.8% | 6.7% | 6.9% | 7.2% | 7.5% | 7.6% | 7.2% | 7.5% | 8.2% | 8.3% | 8.4% | 8.6% | 8.7% | 8.9% | 9.1% | 9.3% | 9.2% | 9.0% | 9.1% Europe | 29.6% | 29.6% | 28.3% | 29.9% | 28.3% | 25.6% | 26.5% | 27.7% | 29.4% | 29.8% | 28.6% | 28.2% | 28.8% | 27.9% | 24.9% | 22.7% | 22.4% | 20.4% | 20.7% | 20.8% | 19.4% | 19.7% | 19.4% | 19.5% | 18.9% | 18.5% |
| United States | 21.4% | 22.0% | 23.3% | 24.8% | 25.4% | 25.7% | 25.6% | 25.2% | 23.4% | 22.0% | 21.6% | 21.2% | 19.3% | 17.4% | 17.8% | 16.7% | 15.5% | 15.8% | 15.9% | 15.9% | 17.1% | 16.9% | 16.5% | 16.5% | 16.6% | 16.1% | ||||||||||||||||||||||||||
| Rest of World | 16.5% | 17.4% | 18.5% | 18.2% | 17.1% | 17.7% | 18.3% | 17.9% | 18.2% | 19.0% | 20.4% | 21.4% | 22.2% | 23.1% | 22.3% | 23.5% | 24.1% | 23.9% | 23.8% | 23.1% | 21.9% | 21.3% | 21.7% | 21.0% | 21.0% | 20.3% |
Source: OECD Trade in Value Added.
China's Planning Is Long-Term and Usually Predictable
China's party-state likes to plan for techno-industrial development. Some plans span a decade or more, such as the Medium- and Long-Term Science and Technology Plan (2021–2035) and the Made in China 2025 initiative. Others are more routine, like the cascade of five-year plans (PDF) under which central and sub-national governments operate. Many are specific to industries, such as the New Energy Vehicle Industry Development Plan (2021–2035) and the 14th Five-Year Plan for the Development of the Robotics Industry (2021–2025) (PDF).
These documents set goals, guide stakeholders, coordinate across party-state institutions at the central and local levels, and establish some predictability and transparency that can strengthen the business environment. When Beijing needs to respond to unexpected developments, it can update plans and offer new strategic guidance. Chinese leaders know their signals guide the party-state apparatus, firms, and the largely state-owned financial sector.
Investors often perceive priority sectors, including emerging technologies, as relatively safe bets partly backstopped by the party-state. On one hand, this approach helps attract investment and foster innovation. On the other hand, it has contributed to current structural issues such as China's excess capacity in sectors where demand has been lower than expected.
China's Export-Oriented Growth Depended on Larger External Markets
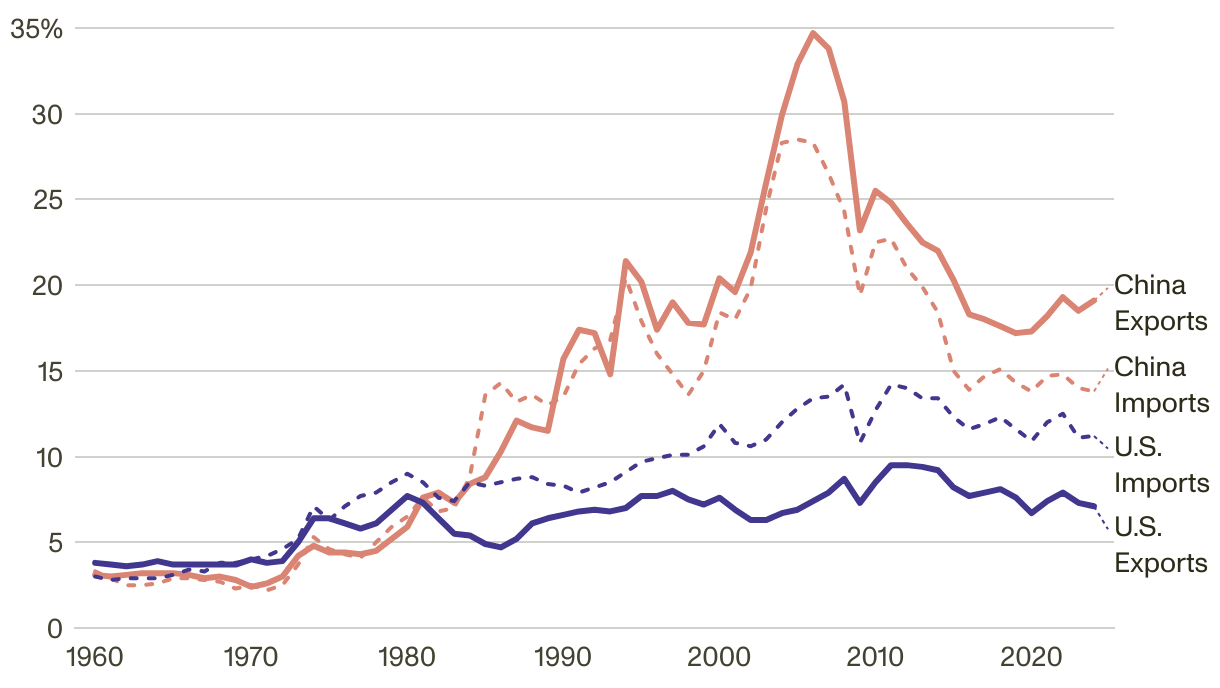
China's exports haven't driven a substantial share of its economic growth—either through net exports or export-related investment—since the late 2000s. China's trade dependency—goods exports and imports relative to GDP—peaked during that period (Figure 4). In recent years, net exports have played a larger role due to China's weak domestic demand, but Beijing knows that it cannot rely on exports for sustainable growth. China's 2025 economic plan focuses on boosting domestic consumption. In response to the escalation in the U.S.-China trade war in April, official state media called for doubling down on consumption.
Figure 4: China's Trade Dependency Declined in the 2010s, While America's Has Been Comparatively Stable for 20 Years
Goods Trade as Shares of GDP
| Year | 1960 | 1961 | 1962 | 1963 | 1964 | 1965 | 1966 | 1967 | 1968 | 1969 | 1970 | 1971 | 1972 | 1973 | 1974 | 1975 | 1976 | 1977 | 1978 | 1979 | 1980 | 1981 | 1982 | 1983 | 1984 | 1985 | 1986 | 1987 | 1988 | 1989 | 1990 | 1991 | 1992 | 1993 | 1994 | 1995 | 1996 | 1997 | 1998 | 1999 | 2000 | 2001 | 2002 | 2003 | 2004 | 2005 | 2006 | 2007 | 2008 | 2009 | 2010 | 2011 | 2012 | 2013 | 2014 | 2015 | 2016 | 2017 | 2018 | 2019 | 2020 | 2021 | 2022 | 2023 | 2024 |
|---|---|---|---|---|---|---|---|---|---|---|---|---|---|---|---|---|---|---|---|---|---|---|---|---|---|---|---|---|---|---|---|---|---|---|---|---|---|---|---|---|---|---|---|---|---|---|---|---|---|---|---|---|---|---|---|---|---|---|---|---|---|---|---|---|---|
| China Exports | 3.1% | 3.0% | 3.1% | 3.2% | 3.2% | 3.2% | 3.1% | 2.9% | 3.0% | 2.8% | 2.4% | 2.6% | 3.0% | 4.2% | 4.8% | 4.4% | 4.4% | 4.3% | 4.5% | 5.2% | 5.9% | 7.6% | 7.9% | 7.3% | 8.4% | 8.8% | 10.3% | 12.1% | 11.7% | 11.5% | 15.7% | 17.4% | 17.2% | 14.8% | 21.4% | 20.2% | 17.4% | 19.0% | 17.8% | 17.7% | 20.4% | 19.6% | 21.9% | 26.0% | 29.9% | 32.9% | 34.7% | 33.8% | 30.7% | 23.2% | 25.5% | 24.8% | 23.6% | 22.5% | 22.0% | 20.3% | 18.3% | 18.0% | 17.6% | 17.2% | 17.3% | 18.2% | 19.3% | 18.5% | 19.1% |
| China Imports | 3.3% | 2.9% | 2.5% | 2.5% | 2.6% | 2.9% | 2.9% | 2.8% | 2.7% | 2.3% | 2.5% | 2.2% | 2.5% | 3.7% | 5.3% | 4.6% | 4.3% | 4.1% | 5.0% | 5.9% | 6.5% | 7.6% | 6.8% | 7.0% | 8.8% | 13.6% | 14.3% | 13.2% | 13.6% | 13.0% | 13.5% | 15.4% | 16.3% | 16.8% | 20.4% | 17.9% | 16.0% | 14.8% | 13.6% | 15.0% | 18.4% | 18.0% | 19.8% | 24.5% | 28.3% | 28.5% | 28.3% | 26.5% | 24.3% | 19.4% | 22.5% | 22.7% | 21.0% | 19.9% | 18.4% | 15.0% | 13.9% | 14.7% | 15.1% | 14.3% | 13.8% | 14.7% | 14.8% | 14.0% | 13.8% |
| U.S. Exports | 3.8% | 3.7% | 3.6% | 3.7% | 3.9% | 3.7% | 3.7% | 3.7% | 3.7% | 3.7% | 4.0% | 3.8% | 3.9% | 5.0% | 6.4% | 6.4% | 6.1% | 5.8% | 6.1% | 6.9% | 7.7% | 7.3% | 6.4% | 5.5% | 5.4% | 4.9% | 4.7% | 5.2% | 6.1% | 6.4% | 6.6% | 6.8% | 6.9% | 6.8% | 7.0% | 7.7% | 7.7% | 8.0% | 7.5% | 7.2% | 7.6% | 6.9% | 6.3% | 6.3% | 6.7% | 6.9% | 7.4% | 7.9% | 8.7% | 7.3% | 8.5% | 9.5% | 9.5% | 9.4% | 9.2% | 8.2% | 7.7% | 7.9% | 8.1% | 7.6% | 6.7% | 7.4% | 7.9% | 7.3% | 7.1% |
| U.S. Imports | 3.0% | 2.8% | 2.9% | 2.9% | 2.9% | 3.1% | 3.4% | 3.3% | 3.8% | 3.8% | 4.0% | 4.2% | 4.6% | 5.2% | 7.1% | 6.3% | 7.1% | 7.7% | 7.9% | 8.5% | 9.0% | 8.5% | 7.6% | 7.4% | 8.5% | 8.3% | 8.5% | 8.7% | 8.8% | 8.4% | 8.3% | 7.9% | 8.2% | 8.5% | 9.1% | 9.7% | 9.9% | 10.1% | 10.1% | 10.6% | 11.9% | 10.8% | 10.6% | 11.0% | 12.0% | 12.8% | 13.4% | 13.5% | 14.2% | 10.8% | 12.7% | 14.2% | 14.0% | 13.4% | 13.4% | 12.3% | 11.6% | 11.9% | 12.3% | 11.6% | 10.9% | 12.0% | 12.5% | 11.1% | 11.2% |
Sources: Bureau of Economic Analysis (United States), General Administration of Customs (China), IMF, National Bureau of Statistics (China), and U.S. Census Bureau via CEIC.
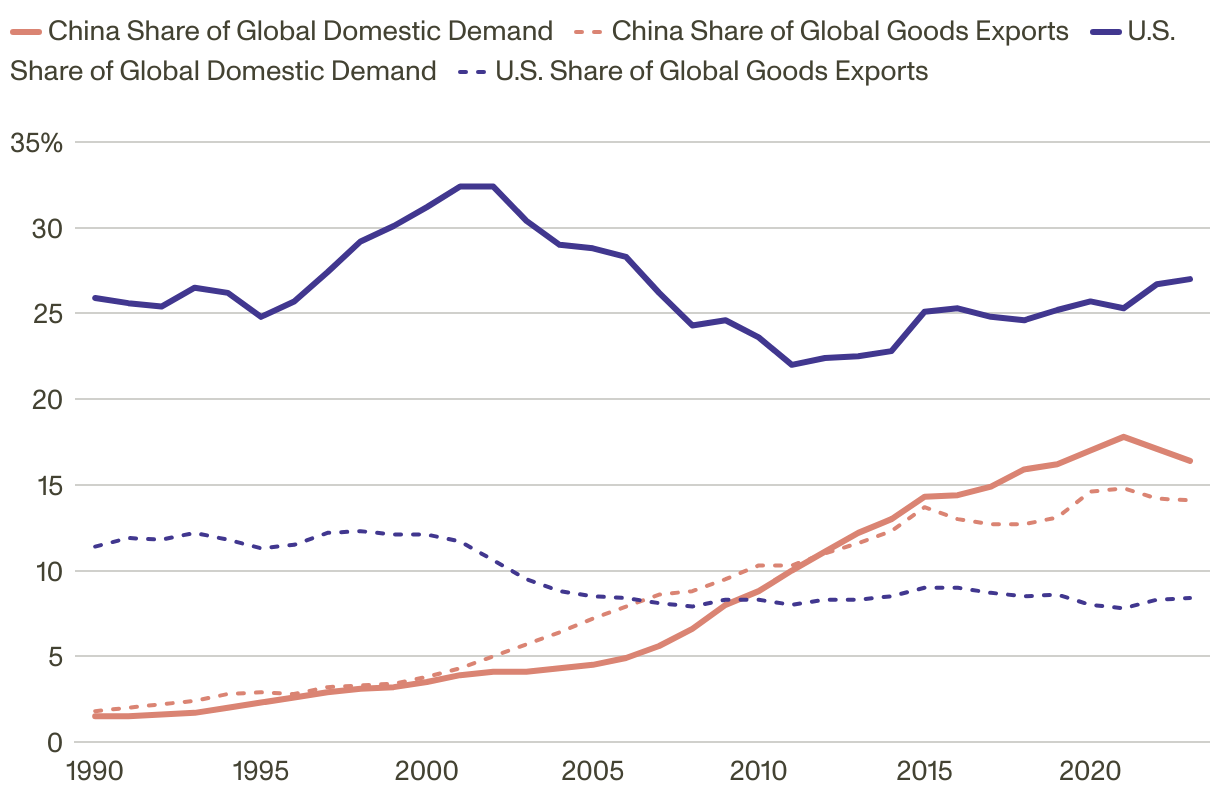
China's economy is too large compared to the global economy to rely on exports for sustained growth, and if tried, other countries—including developing economies—would likely resist by erecting trade barriers. Its share of global exports exceeded its share of global domestic demand (its internal market) in the 1990s and 2000s, but since then, its domestic demand has had a larger global share (Figure 5). As the biggest economy, the United States would face similar challenges. The difference between its share of the global economy and its share of global exports is far larger.
Figure 5: U.S. Economy Is Too Big to Replicate China's Export-Oriented Growth from the 2000s
| Year | 1990 | 1991 | 1992 | 1993 | 1994 | 1995 | 1996 | 1997 | 1998 | 1999 | 2000 | 2001 | 2002 | 2003 | 2004 | 2005 | 2006 | 2007 | 2008 | 2009 | 2010 | 2011 | 2012 | 2013 | 2014 | 2015 | 2016 | 2017 | 2018 | 2019 | 2020 | 2021 | 2022 | 2023 |
|---|---|---|---|---|---|---|---|---|---|---|---|---|---|---|---|---|---|---|---|---|---|---|---|---|---|---|---|---|---|---|---|---|---|---|
| China Share of Global Domestic Demand | 1.5% | 1.5% | 1.6% | 1.7% | 2.0% | 2.3% | 2.6% | 2.9% | 3.1% | 3.2% | 3.5% | 3.9% | 4.1% | 4.1% | 4.3% | 4.5% | 4.9% | 5.6% | 6.6% | 8.0% | 8.8% | 10.0% | 11.1% | 12.2% | 13.0% | 14.3% | 14.4% | 14.9% | 15.9% | 16.2% | 17.0% | 17.8% | 17.1% | 16.4% |
| China Share of Global Goods Exports | 1.8% | 2.0% | 2.2% | 2.4% | 2.8% | 2.9% | 2.8% | 3.2% | 3.3% | 3.4% | 3.8% | 4.3% | 5.0% | 5.7% | 6.4% | 7.2% | 7.9% | 8.6% | 8.8% | 9.5% | 10.3% | 10.3% | 11.0% | 11.6% | 12.3% | 13.7% | 13.0% | 12.7% | 12.7% | 13.1% | 14.6% | 14.8% | 14.2% | 14.1% |
| U.S. Share of Global Domestic Demand | 25.9% | 25.6% | 25.4% | 26.5% | 26.2% | 24.8% | 25.7% | 27.4% | 29.2% | 30.1% | 31.2% | 32.4% | 32.4% | 30.4% | 29.0% | 28.8% | 28.3% | 26.2% | 24.3% | 24.6% | 23.6% | 22.0% | 22.4% | 22.5% | 22.8% | 25.1% | 25.3% | 24.8% | 24.6% | 25.2% | 25.7% | 25.3% | 26.7% | 27.0% |
| U.S. Share of Global Goods Exports | 11.4% | 11.9% | 11.8% | 12.2% | 11.8% | 11.3% | 11.5% | 12.2% | 12.3% | 12.1% | 12.1% | 11.7% | 10.6% | 9.5% | 8.8% | 8.5% | 8.4% | 8.1% | 7.9% | 8.3% | 8.3% | 8.0% | 8.3% | 8.3% | 8.5% | 9.0% | 9.0% | 8.7% | 8.5% | 8.6% | 8.0% | 7.8% | 8.3% | 8.4% |
Source: World Bank via CEIC.
Note: Domestic demand includes final consumption expenditures and gross capital formation.
China No Longer Undervalues Its Exchange Rate to Boost Exports
Beijing kept the yuan's exchange rate artificially low (PDF) from the 2000s until around 2014 to boost exports and to accumulate foreign exchange reserves as a buffer. Since 2015, however, China's central bank and state-owned commercial banks have intervened to prop up the exchange rate more than to push it down, partly due to fears about capital outflows. Chinese leaders likely believe that fully opening the capital account to allow two-way flows would cause depreciation and volatility. China's exchange rate policy prioritizes economic and financial stability over exports.
Consequently, China is no longer the world's top accumulator of foreign exchange reserves. From the late 1990s through the 2000s, China, other Asian economies, and other emerging markets channeled their current account (trade) surpluses into official reserves faster than their economies could grow (Figure 6). That era ended in the 2010s. This complicates the argument that the dollar's role as the world's top reserve currency is what compels the United States to run current account (trade) deficits. To the extent that's true, private investors—not governments like Beijing—are the driving force.
Figure 6: The Era of Global Foreign Exchange Reserve Accumulation Ended in the 2010s
Foreign Exchange Reserves as Share of Global GDP (excluding United States)

| Year | 1970 | 1971 | 1972 | 1973 | 1974 | 1975 | 1976 | 1977 | 1978 | 1979 | 1980 | 1981 | 1982 | 1983 | 1984 | 1985 | 1986 | 1987 | 1988 | 1989 | 1990 | 1991 | 1992 | 1993 | 1994 | 1995 | 1996 | 1997 | 1998 | 1999 | 2000 | 2001 | 2002 | 2003 | 2004 | 2005 | 2006 | 2007 | 2008 | 2009 | 2010 | 2011 | 2012 | 2013 | 2014 | 2015 | 2016 | 2017 | 2018 | 2019 | 2020 | 2021 | 2022 | 2023 |
|---|---|---|---|---|---|---|---|---|---|---|---|---|---|---|---|---|---|---|---|---|---|---|---|---|---|---|---|---|---|---|---|---|---|---|---|---|---|---|---|---|---|---|---|---|---|---|---|---|---|---|---|---|---|---|
| Global Reserves (excluding United States) | 2.30% | 3.75% | 4.06% | 3.76% | 3.99% | 3.69% | 3.96% | 4.60% | 4.44% | 4.30% | 4.23% | 3.83% | 3.64% | 3.81% | 4.02% | 4.27% | 3.98% | 5.03% | 4.54% | 4.56% | 4.81% | 4.96% | 4.67% | 5.19% | 5.55% | 5.70% | 6.42% | 6.84% | 7.10% | 7.57% | 8.07% | 8.76% | 9.89% | 10.77% | 11.61% | 12.32% | 13.72% | 15.17% | 14.78% | 17.51% | 17.86% | 17.36% | 18.33% | 19.09% | 18.52% | 19.04% | 18.44% | 18.37% | 17.19% | 17.68% | 19.64% | 17.37% | 15.68% | 15.68% |
| China | 0.00% | 0.00% | 0.00% | 0.00% | 0.00% | 0.00% | 0.00% | 0.04% | 0.02% | 0.03% | 0.03% | 0.06% | 0.13% | 0.17% | 0.20% | 0.14% | 0.10% | 0.12% | 0.12% | 0.12% | 0.17% | 0.24% | 0.10% | 0.11% | 0.25% | 0.31% | 0.44% | 0.60% | 0.64% | 0.67% | 0.70% | 0.92% | 1.19% | 1.45% | 1.91% | 2.35% | 2.81% | 3.48% | 3.94% | 5.18% | 5.52% | 5.44% | 5.57% | 6.27% | 6.16% | 5.82% | 5.20% | 5.06% | 4.64% | 4.67% | 4.99% | 4.38% | 4.13% | 4.13% |
| Japan | 0.17% | 0.64% | 0.65% | 0.31% | 0.29% | 0.24% | 0.30% | 0.38% | 0.45% | 0.22% | 0.25% | 0.29% | 0.23% | 0.24% | 0.27% | 0.26% | 0.35% | 0.60% | 0.63% | 0.53% | 0.41% | 0.35% | 0.33% | 0.46% | 0.56% | 0.73% | 0.87% | 0.90% | 0.90% | 1.20% | 1.47% | 1.68% | 1.88% | 2.35% | 2.58% | 2.38% | 2.30% | 2.16% | 2.03% | 2.15% | 2.01% | 2.09% | 2.01% | 1.97% | 1.92% | 2.06% | 2.00% | 1.94% | 1.83% | 1.89% | 2.04% | 1.73% | 1.46% | 1.49% |
| Other East and Southeast Asia | 0.20% | 0.21% | 0.26% | 0.30% | 0.30% | 0.25% | 0.36% | 0.37% | 0.35% | 0.33% | 0.35% | 0.40% | 0.38% | 0.52% | 0.60% | 0.70% | 0.81% | 0.97% | 0.93% | 0.99% | 1.09% | 1.19% | 1.24% | 1.41% | 1.48% | 1.42% | 1.53% | 1.50% | 1.78% | 1.23% | 1.37% | 1.57% | 1.82% | 2.10% | 2.26% | 2.23% | 2.31% | 2.32% | 2.11% | 2.81% | 2.88% | 2.75% | 2.87% | 2.81% | 2.75% | 2.98% | 3.04% | 3.12% | 2.94% | 3.06% | 3.60% | 3.25% | 2.77% | 2.83% |
| Europe | 1.17% | 1.89% | 1.90% | 1.92% | 1.62% | 1.51% | 1.43% | 1.86% | 2.05% | 2.13% | 2.08% | 1.73% | 1.59% | 1.70% | 1.75% | 1.95% | 1.83% | 2.44% | 2.06% | 2.09% | 2.28% | 2.17% | 1.99% | 2.02% | 2.07% | 2.01% | 2.11% | 2.14% | 2.06% | 2.70% | 2.66% | 2.59% | 2.81% | 2.52% | 2.44% | 2.35% | 2.70% | 3.00% | 2.50% | 2.87% | 2.99% | 2.78% | 3.19% | 3.19% | 2.88% | 3.27% | 3.49% | 3.73% | 3.58% | 3.77% | 4.46% | 3.94% | 3.48% | 3.30% |
| Gulf Cooperation Council | 0.05% | 0.09% | 0.13% | 0.17% | 0.47% | 0.60% | 0.68% | 0.70% | 0.42% | 0.39% | 0.40% | 0.51% | 0.48% | 0.39% | 0.35% | 0.36% | 0.23% | 0.22% | 0.18% | 0.19% | 0.13% | 0.16% | 0.14% | 0.14% | 0.14% | 0.14% | 0.17% | 0.18% | 0.19% | 0.21% | 0.24% | 0.25% | 0.29% | 0.27% | 0.27% | 0.65% | 0.83% | 1.07% | 1.18% | 1.11% | 1.12% | 1.16% | 1.40% | 1.54% | 1.53% | 1.45% | 1.27% | 1.11% | 1.10% | 1.14% | 1.08% | 0.97% | 1.01% | 1.03% |
| Other | 0.71% | 0.91% | 1.12% | 1.06% | 1.31% | 1.08% | 1.19% | 1.24% | 1.15% | 1.21% | 1.12% | 0.85% | 0.82% | 0.79% | 0.86% | 0.87% | 0.67% | 0.67% | 0.61% | 0.65% | 0.73% | 0.84% | 0.87% | 1.05% | 1.06% | 1.09% | 1.30% | 1.52% | 1.54% | 1.56% | 1.63% | 1.75% | 1.90% | 2.08% | 2.14% | 2.35% | 2.77% | 3.14% | 3.02% | 3.39% | 3.34% | 3.14% | 3.30% | 3.31% | 3.29% | 3.45% | 3.44% | 3.41% | 3.11% | 3.16% | 3.47% | 3.10% | 2.83% | 2.89% |
Source: IMF via CEIC.
China Focused on Productivity, Not Jobs
China's techno-industrial policies aim (PDF) to move up the value chain, lead future technologies, gain global market share, and achieve self-reliance, with an eye to national security. Job creation hasn't been the priority for over a decade (PDF) because Chinese leaders understand that higher manufacturing productivity means fewer workers per output unit.
Instead, the focus in China's manufacturing sector is on automation. Factories are designed to operate without workers (“dark factories”) as firms adopt AI, robotics, and advanced manufacturing technologies. China doubled its robot intensity (industrial robots per worker) in four years and, as of 2023, had surpassed the United States in robot intensity.
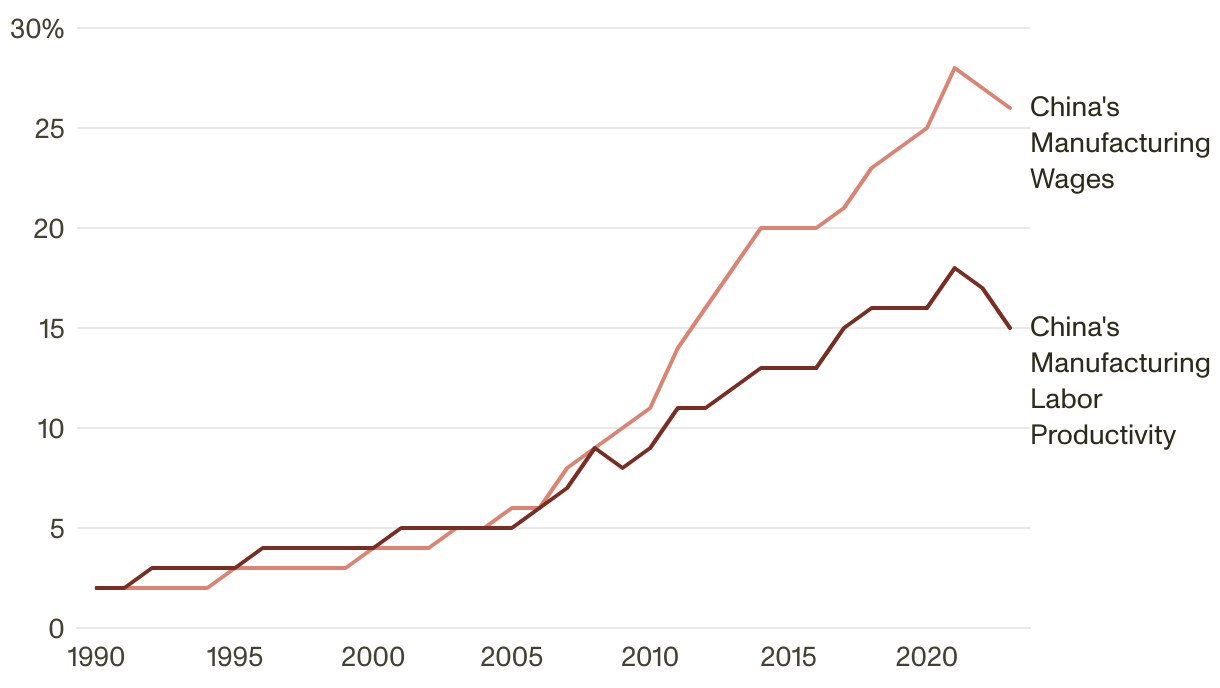
Still, China's manufacturing wages have converged more with the United States than its manufacturing labor productivity has, at least at the aggregate level, if not across industries (Figure 7). This, combined with China's aging population, helps explain Beijing's focus on manufacturing automation rather than job creation.
Figure 7: China's Manufacturing Labor Costs and Productivity Remain Lower Than the United States
Share of U.S. Level
| Year | 1990 | 1991 | 1992 | 1993 | 1994 | 1995 | 1996 | 1997 | 1998 | 1999 | 2000 | 2001 | 2002 | 2003 | 2004 | 2005 | 2006 | 2007 | 2008 | 2009 | 2010 | 2011 | 2012 | 2013 | 2014 | 2015 | 2016 | 2017 | 2018 | 2019 | 2020 | 2021 | 2022 | 2023 |
|---|---|---|---|---|---|---|---|---|---|---|---|---|---|---|---|---|---|---|---|---|---|---|---|---|---|---|---|---|---|---|---|---|---|---|
| China's Manufacturing Wages | 2% | 2% | 2% | 2% | 2% | 3% | 3% | 3% | 3% | 3% | 4% | 4% | 4% | 5% | 5% | 6% | 6% | 8% | 9% | 10% | 11% | 14% | 16% | 18% | 20% | 20% | 20% | 21% | 23% | 24% | 25% | 28% | 27% | 26% |
| China's Manufacturing Labor Productivity | 2% | 2% | 3% | 3% | 3% | 3% | 4% | 4% | 4% | 4% | 4% | 5% | 5% | 5% | 5% | 5% | 6% | 7% | 9% | 8% | 9% | 11% | 11% | 12% | 13% | 13% | 13% | 15% | 16% | 16% | 16% | 18% | 17% | 15% |
Sources: Asia Productivity Organization, Bureau of Economic Analysis (United States), Bureau of Labor Statistics (United States), Ministry of Human Resources and Social Security (China), and National Bureau of Statistics (China) via CEIC.
Note: Manufacturing labor productivity is estimated by dividing national manufacturing value added in current U.S. dollars by national employment in manufacturing.
China Investing in Government-Financed R&D
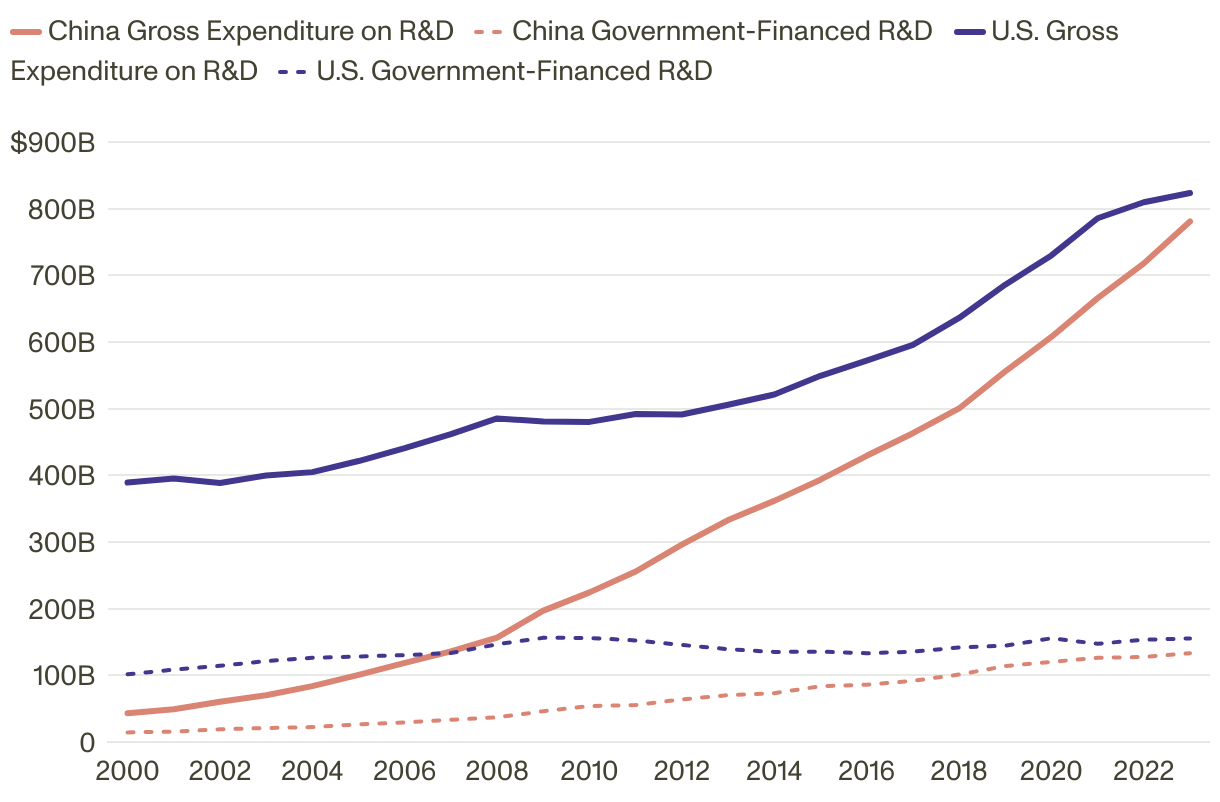
Beijing has also doubled down on R&D spending, including by increasing tax incentives for technology-related R&D and a recent push to expand basic research, where China lags behind the United States. Enterprises pay for most of China's R&D spending, but government spending on R&D has risen rapidly. Beijing's science and technology budget has exceeded 0.8 percent of GDP for over a decade. China is on track to overtake the United States in R&D spending in purchasing power parity terms (Figure 8).
Figure 8: China Is Catching Up to the United States in R&D Spending
U.S. Dollars (Billion, Purchasing Power Parity, 2020 Prices)
| Year | 2000 | 2001 | 2002 | 2003 | 2004 | 2005 | 2006 | 2007 | 2008 | 2009 | 2010 | 2011 | 2012 | 2013 | 2014 | 2015 | 2016 | 2017 | 2018 | 2019 | 2020 | 2021 | 2022 | 2023 |
|---|---|---|---|---|---|---|---|---|---|---|---|---|---|---|---|---|---|---|---|---|---|---|---|---|
| China Gross Expenditure on R&D | 43.2 | 49.2 | 60.3 | 70.2 | 83.8 | 100.6 | 118.6 | 135.8 | 156.7 | 197.1 | 224.4 | 255.8 | 296.1 | 332.9 | 361.7 | 393.5 | 429.3 | 463.2 | 500.3 | 555.9 | 607.6 | 665.8 | 717.9 | 780.7 |
| China Government-Financed R&D | 14.4 | 15.6 | 19.1 | 21.0 | 22.3 | 26.5 | 29.3 | 33.4 | 37.0 | 46.1 | 53.9 | 55.4 | 63.9 | 70.3 | 73.3 | 83.7 | 86.0 | 91.7 | 101.2 | 113.9 | 120.2 | 126.2 | 127.6 | 133.2 |
| U.S. Gross Expenditure on R&D | 389.1 | 395.4 | 388.5 | 399.7 | 404.8 | 421.5 | 440.7 | 461.9 | 485.3 | 480.9 | 480.2 | 491.9 | 491.2 | 505.9 | 521.2 | 549.3 | 572.1 | 595.8 | 636.1 | 686.0 | 729.9 | 785.6 | 809.6 | 823.4 |
| U.S. Government-Financed R&D | 101.5 | 108.6 | 114.3 | 121.4 | 126.3 | 128.3 | 130.3 | 133.4 | 146.6 | 156.3 | 156.1 | 152.4 | 145.5 | 139.2 | 135.1 | 135.6 | 133.1 | 135.5 | 141.8 | 144.5 | 155.5 | 147.4 | 153.4 | 155.4 |
Source: OECD via CEIC.
Note: Purchasing power parity exchange rates reflect that a large share of R&D spending is on labor costs.
Lessons for Washington
Of course, the United States isn't trying to replicate China's industrial strategy, and this article does not argue it should. Nonetheless, there are lessons Washington can learn from Beijing's approach over the past 30 years.
First, China does not vindicate a traditional import substitution strategy and instead highlights the importance of using many instruments, including foreign direct investment. Tariffs can be a tool, but they weren't the primary tool for China. Doing industrial policy without using fiscal resources (or in China's case, quasi-fiscal or state-sector resources) is hard.
Second, while state planning has limits and can harm the economy, any government plan should be multiyear and enhance predictability. Businesses need to have the confidence to invest for industrial strategies to succeed.
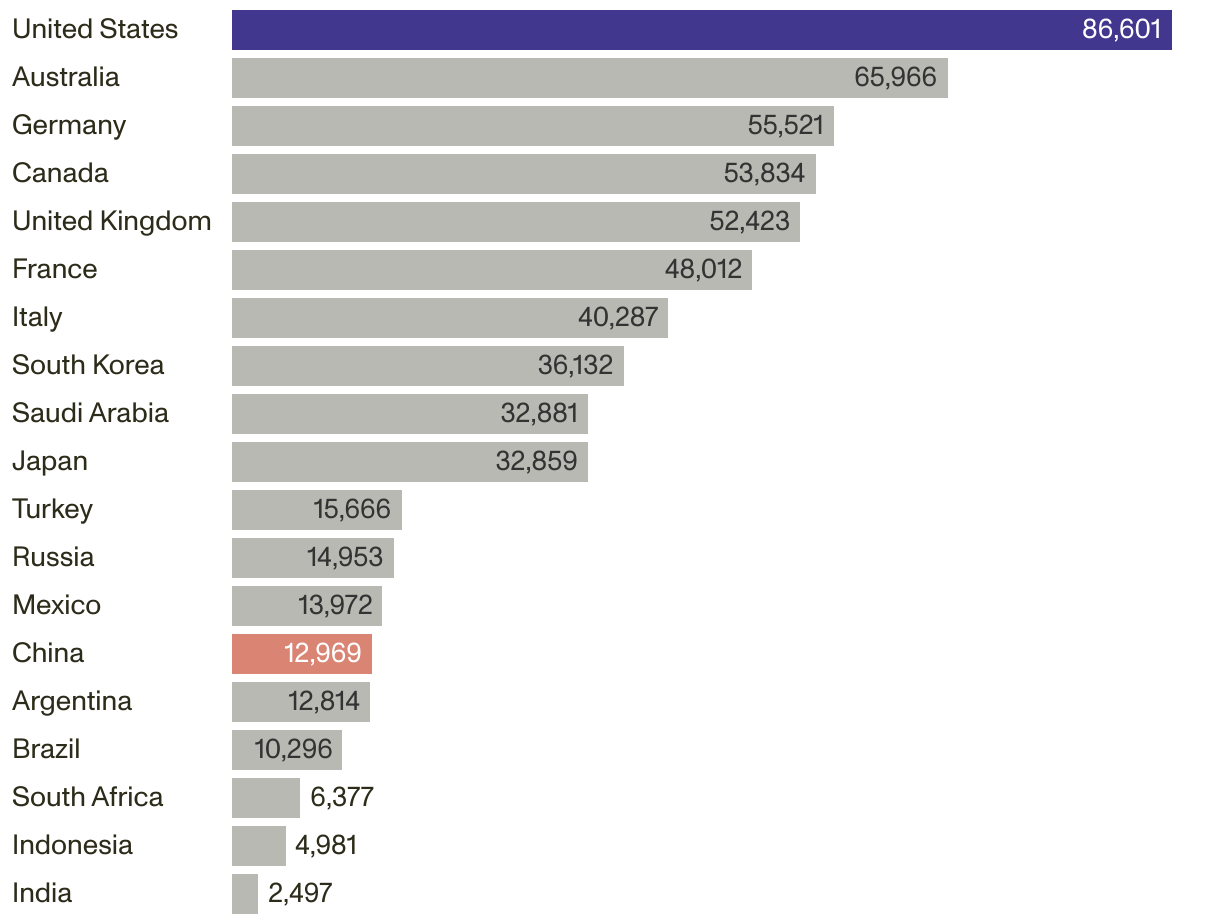
Third, China was able to achieve export-oriented growth in the 2000s because it was comparatively poor at the time. The United States is by far the richest of all major economies (Figure 9). There are markets for U.S. goods, but high manufacturing costs and the limited number of alternative markets with substantial final demand will make it hard to propel the U.S. economy overall with manufacturing exports.
Figure 9: U.S. GDP Per Capita Is Higher Than Other Major Economies
U.S. Dollars at Market Exchange Rates, 2024
| Country | U.S. Dollars |
|---|---|
| United States | 86,601 |
| Australia | 65,966 |
| Germany | 55,521 |
| Canada | 53,834 |
| United Kingdom | 52,423 |
| France | 48,012 |
| Italy | 40,287 |
| South Korea | 36,132 |
| Saudi Arabia | 32,881 |
| Japan | 32,859 |
| Turkey | 15,666 |
| Russia | 14,953 |
| Mexico | 13,972 |
| China | 12,969 |
| Argentina | 12,814 |
| Brazil | 10,296 |
| South Africa | 6,377 |
| Indonesia | 4,981 |
| India | 2,497 |
Source: IMF World Economic Outlook via CEIC.
Fourth, Beijing is no longer keeping China's exchange rate artificially weak, and is now likely fighting to manage depreciation pressure in the face of U.S. tariffs. One can argue whether the U.S. dollar's global role is an “exorbitant” privilege or burden. But if Washington seeks a stronger yuan against the dollar, China's central bank—and others across emerging markets—will have a far more difficult time engineering reevaluation than they would have 20 years ago when they were accumulating reserves.
Innovation and productivity are essential for global manufacturing competitiveness.
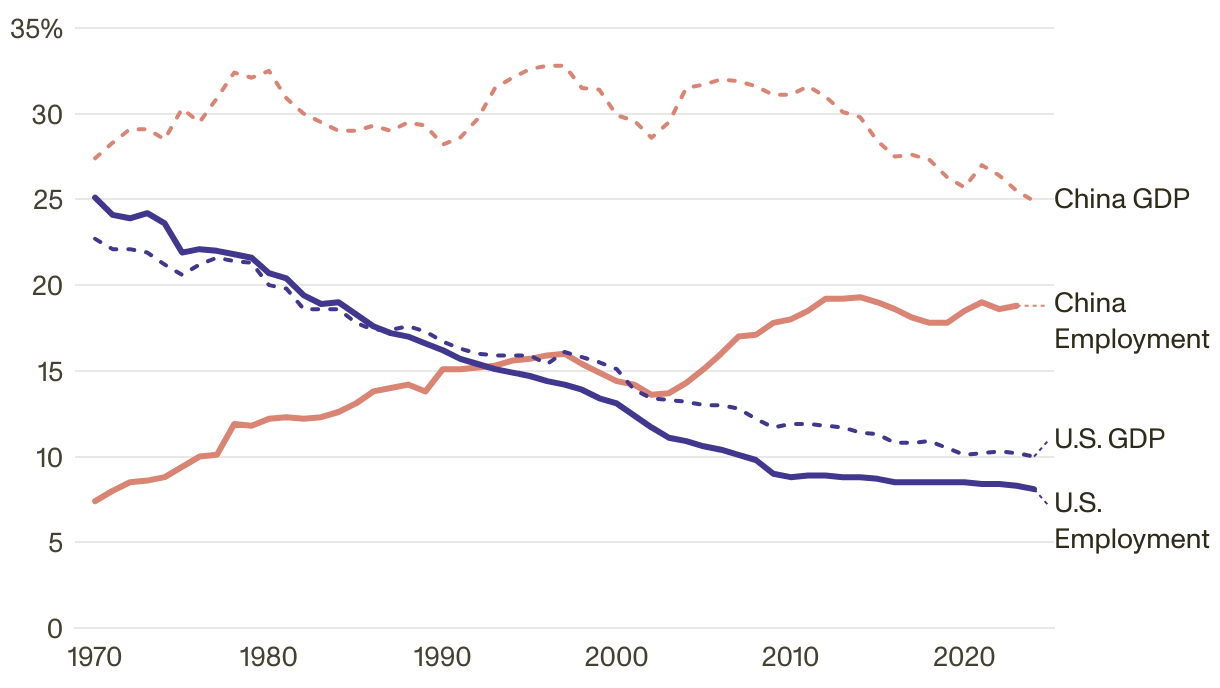
Fifth, innovation and productivity are essential for global manufacturing competitiveness. Since costs are higher in the United States than in China, a globally competitive U.S. manufacturing sector might be even more automated. That means any increase in manufacturing's share of the U.S. economy probably won't be matched by any increase in manufacturing's share of employment (Figure 10). Increased U.S. manufacturing could improve innovation and national security, but it's not the best vehicle for job growth and it's unlikely to “bring back” jobs lost during the “China shock” of the 2000s.
Figure 10: U.S. Manufacturing Fell as a Share of GDP as Services Grew, but Manufacturing Remains Large as a Share of China's Economy
| Year | 1970 | 1971 | 1972 | 1973 | 1974 | 1975 | 1976 | 1977 | 1978 | 1979 | 1980 | 1981 | 1982 | 1983 | 1984 | 1985 | 1986 | 1987 | 1988 | 1989 | 1990 | 1991 | 1992 | 1993 | 1994 | 1995 | 1996 | 1997 | 1998 | 1999 | 2000 | 2001 | 2002 | 2003 | 2004 | 2005 | 2006 | 2007 | 2008 | 2009 | 2010 | 2011 | 2012 | 2013 | 2014 | 2015 | 2016 | 2017 | 2018 | 2019 | 2020 | 2021 | 2022 | 2023 | 2024 |
|---|---|---|---|---|---|---|---|---|---|---|---|---|---|---|---|---|---|---|---|---|---|---|---|---|---|---|---|---|---|---|---|---|---|---|---|---|---|---|---|---|---|---|---|---|---|---|---|---|---|---|---|---|---|---|---|
| China Employment | 7% | 8% | 8% | 9% | 9% | 9% | 10% | 10% | 12% | 12% | 12% | 12% | 12% | 12% | 13% | 13% | 14% | 14% | 14% | 14% | 15% | 15% | 15% | 15% | 16% | 16% | 16% | 16% | 15% | 15% | 14% | 14% | 14% | 14% | 14% | 15% | 16% | 17% | 17% | 18% | 18% | 18% | 19% | 19% | 19% | 19% | 19% | 18% | 18% | 18% | 19% | 19% | 19% | 19% | |
| China GDP | 27% | 28% | 29% | 29% | 28% | 30% | 30% | 31% | 32% | 32% | 32% | 31% | 30% | 30% | 29% | 29% | 29% | 29% | 30% | 29% | 28% | 29% | 30% | 32% | 32% | 33% | 33% | 33% | 31% | 31% | 30% | 30% | 29% | 29% | 32% | 32% | 32% | 32% | 32% | 31% | 31% | 32% | 31% | 30% | 30% | 28% | 28% | 28% | 27% | 26% | 26% | 27% | 26% | 25% | 25% |
| U.S. Employment | 25% | 24% | 24% | 24% | 24% | 22% | 22% | 22% | 22% | 22% | 21% | 20% | 19% | 19% | 19% | 18% | 18% | 17% | 17% | 17% | 16% | 16% | 15% | 15% | 15% | 15% | 14% | 14% | 14% | 13% | 13% | 12% | 12% | 11% | 11% | 11% | 10% | 10% | 10% | 9% | 9% | 9% | 9% | 9% | 9% | 9% | 9% | 8% | 8% | 8% | 9% | 8% | 8% | 8% | 8% |
| U.S. GDP | 23% | 22% | 22% | 22% | 21% | 21% | 21% | 22% | 21% | 21% | 20% | 20% | 19% | 19% | 19% | 18% | 17% | 17% | 18% | 17% | 17% | 16% | 16% | 16% | 16% | 16% | 15% | 16% | 16% | 15% | 15% | 14% | 13% | 13% | 13% | 13% | 13% | 13% | 12% | 12% | 12% | 12% | 12% | 12% | 11% | 11% | 11% | 11% | 11% | 11% | 10% | 10% | 10% | 10% | 10% |
Sources: Asia Productivity Organization, Bureau of Economic Analysis (United States), Bureau of Labor Statistics (United States), Ministry of Human Resources and Social Security (China), and National Bureau of Statistics (China) via CEIC.
Sixth, the government doesn't fund most R&D—even in China—but it plays an important role in scientific and innovative research, especially basic research. China could overtake the United States in overall and government-financed R&D spending within a few years in purchasing power parity terms. R&D spending doesn't directly equal innovation, but it's a factor. Cutting U.S. federal spending on R&D won't help the United States compete with China.
Despite the significant differences in their systems and the growing rivalry between the two countries, China's successes and missteps can still offer valuable lessons to the United States regarding industrial strategy.


