

Today, one hears two narratives about China's economy. One is about economic decline, and the other is about China's growing economic and technological power.
China's economy has slowed substantially. Local governments are straining under debt burdens. The property sector has nearly collapsed. Consumer confidence is poor. External demand is a brittle support beam, as Western governments consider protectionist measures. China's GDP is no longer catching up to the United States.
China is also the top global manufacturer, leading exports of many goods, investing heavily in high-tech sectors, and innovating rapidly, with DeepSeek being just the latest example.
Although these narratives appear contradictory, both are true.
China's high-tech industries are only a small share of its total economy. Those high-tech sectors shaping the “new economy” are indeed growing, but they aren't large enough to offset overall weakness in the “old economy” weighing down key indicators like GDP growth.
Chinese leader Xi Jinping likely bears some of the blame for the macro slowdown. Beijing's plan to tackle property-sector debt was poorly signaled and didn't account for local fiscal impacts. Stimulus has been cautious. And the government's support for investors and entrepreneurs has been inconsistent.
A weaker Chinese economy reduces profits and the number of firms entering emerging sectors. It also means fewer state resources available to support techno-industrial policies.
But for Xi, while the current situation isn't ideal, it may be good enough. China is making progress toward some of his key goals: upgrading its science and technology and increasing its self-reliance. Given the size of China's competitive market, the state's ownership of much of China's financial sector, and investors' willingness to crowd into priority sectors (and away from politically unfavored sectors), there's plenty of money for high-tech Chinese firms to succeed.
It's critical to avoid conflating an economically slowing China with an industrially and technologically weaker China.
For Western policymakers, the lesson is to not confuse macro and micro trends. Even as China's overall economy faces headwinds, the smaller slice represented by high-tech industries will still present strategic problems for the United States for the foreseeable future. Therefore, it's critical to avoid conflating an economically slowing China with an industrially and technologically weaker China.
A Tale of Two Chinese Economies
China's GDP growth has indeed slowed. In 2024, China achieved its politically mandated real (inflation-adjusted) GDP growth target of 5 percent with implausible precision. More plausibly, China reported nominal (not adjusted for inflation) growth of 4.2 percent (Figure 1), the lowest rate in decades apart from the COVID-19 pandemic shock in 2020. Many dispute China's growth statistics, but whatever the true rate, the real world rate (wages, budgets, revenues) is nominal, and the lower nominal growth rate likely reflects the trend that Chinese consumers and businesses are feeling.
Figure 1: China's Growth Has Downshifted
Percentage points, year on year

| Year | 2017 | 2018 | 2019 | 2020 | 2021 | 2022 | 2023 | 2024 |
|---|---|---|---|---|---|---|---|---|
| Nominal GDP Growth | 11.1% | 10.5% | 7.8% | 3.5% | 12.6% | 5.1% | 4.9% | 4.2% |
| Consumption | 6.2% | 6.2% | 5.0% | 0.9% | 6.3% | 2.5% | 5.1% | 1.9% |
| Investment | 5.2% | 5.3% | 2.5% | 1.1% | 5.8% | 1.8% | 0.8% | 1.1% |
| Net Exports | -0.3% | -1.0% | 0.3% | 1.5% | 0.5% | 0.8% | -0.9% | 1.3% |
Source: National Bureau of Statistics via CEIC.
Note: Growth composition estimated for 2024 based on reported contributions in real terms.
China's GDP is below its pre-COVID trend (Figure 2). Household consumption of goods and services is down even more, while growth in total fixed asset investment has collapsed. Exports are propping up overall economic growth, with net exports in 2024 contributing the largest share to growth since 1997.
Figure 2: China's Exports Are Up, Consumption Is Slower, and Investment Is Down

| Date | 03/2019 | 06/2019 | 09/2019 | 12/2019 | 03/2020 | 06/2020 | 09/2020 | 12/2020 | 03/2021 | 06/2021 | 09/2021 | 12/2021 | 03/2022 | 06/2022 | 09/2022 | 12/2022 | 03/2023 | 06/2023 | 09/2023 | 12/2023 | 03/2024 | 06/2024 | 09/2024 | 12/2024 |
|---|---|---|---|---|---|---|---|---|---|---|---|---|---|---|---|---|---|---|---|---|---|---|---|---|
| Nominal GDP (Actual) | 94.6 | 96.4 | 98.1 | 100.0 | 98.8 | 99.5 | 100.9 | 102.9 | 107.4 | 110.8 | 113.6 | 116.7 | 118.9 | 120.0 | 121.7 | 122.7 | 124.2 | 125.9 | 127.2 | 128.7 | 129.9 | 131.2 | 132.5 | 134.1 |
| Nominal GDP (2017-19 Trend) | 94.4 | 96.4 | 98.4 | 100.3 | 102.3 | 104.3 | 106.3 | 108.2 | 110.2 | 112.2 | 114.2 | 116.1 | 118.1 | 120.1 | 122.0 | 124.0 | 126.0 | 127.9 | 129.9 | 131.9 | 133.9 | 135.9 | 137.8 | 139.8 |
| Fixed Asset Investment | 95.8 | 97.3 | 98.6 | 100.0 | 97.6 | 98.6 | 100.6 | 102.9 | 106.2 | 108.3 | 108.2 | 107.9 | 109.4 | 110.9 | 112.6 | 113.4 | 114.3 | 115.4 | 116.0 | 116.9 | 117.7 | 118.9 | 119.8 | 120.6 |
| Consumption per Capita | 93.8 | 95.4 | 97.6 | 100.0 | 97.9 | 97.2 | 97.5 | 98.4 | 102.5 | 106.5 | 109.3 | 111.8 | 113.7 | 113.1 | 114.6 | 113.8 | 115.4 | 118.4 | 121.5 | 124.3 | 126.9 | 128.3 | 129.4 | 130.9 |
| Goods Exports | 97.1 | 98.3 | 99.1 | 100.0 | 97.5 | 98.6 | 101.3 | 104.4 | 111.8 | 116.8 | 120.9 | 126.3 | 129.9 | 133.8 | 138.8 | 139.5 | 142.0 | 142.2 | 140.1 | 139.7 | 140.2 | 142.8 | 144.5 | 147.9 |
| Goods Imports | 98.8 | 99.4 | 98.7 | 100.0 | 100.0 | 98.7 | 99.9 | 100.0 | 104.3 | 111.6 | 116.2 | 121.4 | 123.7 | 124.5 | 126.2 | 126.9 | 127.3 | 127.0 | 125.7 | 126.4 | 127.8 | 129.2 | 129.9 | 129.1 |
Source: General Administration of Customs and National Bureau of Statistics via CEIC.
Note: Indices calculated based on nominal values in yuan. Fixed asset investment values based on reported growth rates.
With the U.S. economy growing faster than China's in dollar terms, China's GDP is no longer catching up, falling from 77 percent of U.S. GDP in 2021 to 64 percent last year (Figure 3). Before the COVID-19 pandemic, many economists expected China's GDP to overtake U.S. GDP in about a decade. But more recent forecasts have China reaching U.S. GDP in the 2040s but only briefly, if ever. Still, despite slower growth in recent years, China's manufacturing sector value added is more than one-and-a-half times that of the United States, and that's without resorting to clunky purchasing-power parity adjustments that primarily make China's domestic service economy seem larger.
Figure 3: China's GDP No Longer Catching Up to United States
China value added as share of U.S. value added, in current U.S. dollars

| Year | 2004 | 2005 | 2006 | 2007 | 2008 | 2009 | 2010 | 2011 | 2012 | 2013 | 2014 | 2015 | 2016 | 2017 | 2018 | 2019 | 2020 | 2021 | 2022 | 2023 | 2024 |
|---|---|---|---|---|---|---|---|---|---|---|---|---|---|---|---|---|---|---|---|---|---|
| Total GDP | 16.2% | 17.8% | 20.2% | 24.9% | 31.6% | 35.8% | 41.2% | 49.2% | 53.4% | 58.2% | 60.5% | 61.1% | 60.9% | 64.0% | 68.5% | 67.6% | 70.2% | 76.9% | 70.5% | 65.9% | 64.3% |
| Manufacturing | 38.9% | 43.3% | 49.8% | 62.3% | 82.0% | 95.1% | 107.6% | 129.9% | 140.1% | 150.1% | 158.0% | 153.3% | 155.0% | 164.1% | 171.1% | 168.6% | 179.6% | 203.8% | 180.5% | 164.1% | 159.4% |
| Services | 8.6% | 9.4% | 10.9% | 13.8% | 17.3% | 19.9% | 22.8% | 27.3% | 30.4% | 34.2% | 36.6% | 38.4% | 39.1% | 41.4% | 45.0% | 45.0% | 46.6% | 50.6% | 47.0% | 44.8% | 43.4% |
Source: Bureau of Economic Analysis (United States) and National Bureau of Statistics (China) via CEIC.
The single most important factor explaining the abrupt end to China's investment-oriented growth model is the correction in the property sector (Figure 4). Before the COVID-19 pandemic, the property sector accounted (PDF) for more than 25 percent of GDP, factoring in all related inputs and services. Beijing tried to get debt-fueled property construction under control with its “three red lines” policy in late 2020. This started a painful process of economic rebalancing but without a clear plan to manage the economic and fiscal aftershocks, especially for local governments.
Figure 4: China's Dramatic Property Sector Contraction
Rolling 12-month sums

| Date | 01/2015 | 02/2015 | 03/2015 | 04/2015 | 05/2015 | 06/2015 | 07/2015 | 08/2015 | 09/2015 | 10/2015 | 11/2015 | 12/2015 | 01/2016 | 02/2016 | 03/2016 | 04/2016 | 05/2016 | 06/2016 | 07/2016 | 08/2016 | 09/2016 | 10/2016 | 11/2016 | 12/2016 | 01/2017 | 02/2017 | 03/2017 | 04/2017 | 05/2017 | 06/2017 | 07/2017 | 08/2017 | 09/2017 | 10/2017 | 11/2017 | 12/2017 | 01/2018 | 02/2018 | 03/2018 | 04/2018 | 05/2018 | 06/2018 | 07/2018 | 08/2018 | 09/2018 | 10/2018 | 11/2018 | 12/2018 | 01/2019 | 02/2019 | 03/2019 | 04/2019 | 05/2019 | 06/2019 | 07/2019 | 08/2019 | 09/2019 | 10/2019 | 11/2019 | 12/2019 | 01/2020 | 02/2020 | 03/2020 | 04/2020 | 05/2020 | 06/2020 | 07/2020 | 08/2020 | 09/2020 | 10/2020 | 11/2020 | 12/2020 | 01/2021 | 02/2021 | 03/2021 | 04/2021 | 05/2021 | 06/2021 | 07/2021 | 08/2021 | 09/2021 | 10/2021 | 11/2021 | 12/2021 | 01/2022 | 02/2022 | 03/2022 | 04/2022 | 05/2022 | 06/2022 | 07/2022 | 08/2022 | 09/2022 | 10/2022 | 11/2022 | 12/2022 | 01/2023 | 02/2023 | 03/2023 | 04/2023 | 05/2023 | 06/2023 | 07/2023 | 08/2023 | 09/2023 | 10/2023 | 11/2023 | 12/2023 | 01/2024 | 02/2024 | 03/2024 | 04/2024 | 05/2024 | 06/2024 | 07/2024 | 08/2024 | 09/2024 | 10/2024 | 11/2024 | 12/2024 |
|---|---|---|---|---|---|---|---|---|---|---|---|---|---|---|---|---|---|---|---|---|---|---|---|---|---|---|---|---|---|---|---|---|---|---|---|---|---|---|---|---|---|---|---|---|---|---|---|---|---|---|---|---|---|---|---|---|---|---|---|---|---|---|---|---|---|---|---|---|---|---|---|---|---|---|---|---|---|---|---|---|---|---|---|---|---|---|---|---|---|---|---|---|---|---|---|---|---|---|---|---|---|---|---|---|---|---|---|---|---|---|---|---|---|---|---|---|---|---|---|---|
| Property Starts (left) | 1766.4 | 1766.4 | 1742.3 | 1721.1 | 1699.8 | 1669.5 | 1630.9 | 1603.9 | 1630.0 | 1590.2 | 1554.6 | 1544.5 | 1563.3 | 1563.3 | 1590.1 | 1621.2 | 1636.7 | 1645.1 | 1656.7 | 1661.1 | 1622.9 | 1647.4 | 1651.9 | 1669.3 | 1685.5 | 1685.5 | 1702.1 | 1717.4 | 1725.9 | 1751.1 | 1743.5 | 1750.9 | 1753.1 | 1746.8 | 1773.0 | 1786.5 | 1791.6 | 1791.6 | 1817.1 | 1821.9 | 1856.7 | 1887.5 | 1930.6 | 1969.5 | 2002.0 | 2022.8 | 2058.7 | 2093.4 | 2104.1 | 2104.1 | 2134.6 | 2161.2 | 2169.3 | 2190.3 | 2202.8 | 2211.8 | 2224.7 | 2262.2 | 2256.4 | 2271.5 | 2187.1 | 2187.1 | 2166.3 | 2163.7 | 2169.0 | 2191.8 | 2214.7 | 2219.4 | 2215.4 | 2222.4 | 2230.4 | 2244.3 | 2311.0 | 2311.0 | 2323.9 | 2305.7 | 2292.5 | 2281.9 | 2233.5 | 2200.2 | 2172.9 | 2104.5 | 2061.7 | 1989.0 | 1968.2 | 1968.2 | 1925.7 | 1847.3 | 1761.7 | 1640.3 | 1560.1 | 1484.5 | 1407.2 | 1358.8 | 1277.1 | 1205.9 | 1191.9 | 1191.9 | 1148.7 | 1120.7 | 1086.8 | 1040.4 | 1014.9 | 994.2 | 979.4 | 960.4 | 964.1 | 953.8 | 912.4 | 912.4 | 885.4 | 876.7 | 857.4 | 835.2 | 821.4 | 809.5 | 793.0 | 774.3 | 752.3 | 738.9 |
| Property Completions (left) | 1058.6 | 1058.6 | 1059.3 | 1049.8 | 1033.7 | 1021.9 | 1017.7 | 1001.8 | 1019.2 | 1047.7 | 1048.1 | 1000.4 | 1031.7 | 1031.7 | 1030.5 | 1043.1 | 1054.6 | 1066.4 | 1081.1 | 1081.6 | 1061.8 | 1040.5 | 1046.6 | 1061.3 | 1083.3 | 1083.3 | 1091.6 | 1088.2 | 1080.1 | 1081.1 | 1072.4 | 1078.3 | 1067.1 | 1065.3 | 1053.4 | 1014.9 | 995.3 | 995.3 | 991.6 | 984.6 | 980.6 | 970.9 | 965.3 | 954.2 | 949.2 | 932.7 | 921.0 | 935.5 | 918.7 | 918.7 | 913.2 | 909.6 | 897.7 | 888.5 | 888.1 | 889.3 | 891.7 | 903.7 | 905.4 | 959.4 | 930.8 | 930.8 | 930.2 | 926.6 | 929.2 | 925.5 | 918.6 | 914.4 | 905.3 | 909.7 | 912.7 | 912.2 | 951.1 | 951.1 | 947.8 | 946.7 | 951.1 | 986.7 | 997.5 | 1008.5 | 1008.9 | 992.7 | 1008.0 | 1014.1 | 1000.9 | 1000.9 | 992.2 | 987.1 | 971.9 | 935.7 | 916.6 | 915.3 | 912.8 | 906.9 | 883.7 | 862.2 | 872.0 | 872.0 | 887.2 | 898.7 | 906.9 | 914.9 | 926.0 | 930.9 | 940.5 | 948.1 | 957.5 | 998.3 | 970.5 | 970.5 | 956.7 | 950.1 | 942.5 | 924.5 | 914.4 | 895.0 | 879.4 | 866.8 | 827.5 | 737.4 |
| Property Sales (left) | 1189.5 | 1189.5 | 1187.9 | 1193.2 | 1205.8 | 1225.5 | 1240.8 | 1253.4 | 1264.2 | 1270.5 | 1281.8 | 1284.9 | 1309.7 | 1309.7 | 1345.4 | 1381.2 | 1404.5 | 1425.3 | 1443.4 | 1462.7 | 1507.7 | 1539.4 | 1550.7 | 1573.5 | 1601.7 | 1601.7 | 1620.8 | 1629.9 | 1642.1 | 1677.1 | 1679.4 | 1684.4 | 1681.7 | 1672.6 | 1680.9 | 1694.1 | 1699.9 | 1699.9 | 1704.6 | 1699.4 | 1710.0 | 1718.9 | 1730.5 | 1733.4 | 1727.1 | 1722.7 | 1714.4 | 1716.5 | 1711.2 | 1711.2 | 1713.9 | 1715.5 | 1707.6 | 1703.0 | 1704.5 | 1710.3 | 1715.2 | 1717.9 | 1719.6 | 1715.6 | 1659.3 | 1659.3 | 1637.1 | 1634.4 | 1647.4 | 1651.8 | 1664.1 | 1682.0 | 1694.5 | 1716.0 | 1734.9 | 1760.9 | 1849.7 | 1849.7 | 1901.1 | 1924.2 | 1937.7 | 1953.2 | 1941.0 | 1917.9 | 1893.5 | 1858.3 | 1833.8 | 1794.3 | 1777.7 | 1777.7 | 1744.7 | 1689.0 | 1637.9 | 1597.2 | 1559.6 | 1531.3 | 1505.2 | 1475.7 | 1425.5 | 1358.4 | 1352.7 | 1352.7 | 1347.4 | 1337.0 | 1315.4 | 1264.3 | 1242.2 | 1219.0 | 1192.2 | 1172.4 | 1151.0 | 1117.4 | 1079.7 | 1079.7 | 1044.6 | 1033.5 | 1019.4 | 1001.4 | 993.2 | 983.9 | 972.1 | 970.9 | 973.4 | 973.9 |
| Government Revenue from Land Sales (right) | 4.2 | 4.0 | 3.9 | 3.8 | 3.6 | 3.5 | 3.4 | 3.3 | 3.2 | 3.2 | 3.2 | 3.3 | 3.3 | 3.3 | 3.3 | 3.3 | 3.3 | 3.4 | 3.4 | 3.5 | 3.5 | 3.6 | 3.7 | 3.7 | 3.8 | 3.9 | 4.0 | 4.0 | 4.1 | 4.2 | 4.4 | 4.5 | 4.7 | 4.8 | 5.0 | 5.2 | 5.3 | 5.5 | 5.6 | 5.7 | 5.9 | 6.0 | 6.1 | 6.2 | 6.2 | 6.3 | 6.4 | 6.5 | 6.5 | 6.4 | 6.4 | 6.4 | 6.5 | 6.5 | 6.6 | 6.7 | 6.8 | 6.9 | 7.1 | 7.3 | 7.2 | 7.2 | 7.2 | 7.2 | 7.3 | 7.4 | 7.5 | 7.6 | 7.7 | 8.0 | 8.2 | 8.4 | 8.6 | 8.8 | 8.9 | 9.0 | 9.0 | 9.0 | 9.0 | 8.9 | 8.8 | 8.8 | 8.8 | 8.7 | 8.6 | 8.4 | 8.3 | 8.0 | 7.8 | 7.6 | 7.5 | 7.3 | 7.2 | 7.0 | 6.9 | 6.7 | 6.6 | 6.5 | 6.4 | 6.3 | 6.2 | 6.2 | 6.1 | 6.0 | 5.9 | 5.9 | 5.8 | 5.8 | 5.8 | 5.8 | 5.7 | 5.6 | 5.6 | 5.5 | 5.3 | 5.2 | 5.0 | 5.0 | 4.9 | 4.9 |
Source: Ministry of Finance and National Bureau of Statistics via CEIC.
The property sector contraction combined with COVID-19 lockdowns hit Chinese consumer confidence hard, and it's unlikely to recover until the property sector recovers, too. Chinese households invest most of their wealth in real estate. It's not surprising that the collapse in consumer confidence—which means lower spending—coincided with the onset of falling housing prices (Figure 5).
Figure 5: China's Slump in Consumer Confidence Began with COVID-19 Lockdowns, Declining Housing Prices

| Date | 01/2018 | 02/2018 | 03/2018 | 04/2018 | 05/2018 | 06/2018 | 07/2018 | 08/2018 | 09/2018 | 10/2018 | 11/2018 | 12/2018 | 01/2019 | 02/2019 | 03/2019 | 04/2019 | 05/2019 | 06/2019 | 07/2019 | 08/2019 | 09/2019 | 10/2019 | 11/2019 | 12/2019 | 01/2020 | 02/2020 | 03/2020 | 04/2020 | 05/2020 | 06/2020 | 07/2020 | 08/2020 | 09/2020 | 10/2020 | 11/2020 | 12/2020 | 01/2021 | 02/2021 | 03/2021 | 04/2021 | 05/2021 | 06/2021 | 07/2021 | 08/2021 | 09/2021 | 10/2021 | 11/2021 | 12/2021 | 01/2022 | 02/2022 | 03/2022 | 04/2022 | 05/2022 | 06/2022 | 07/2022 | 08/2022 | 09/2022 | 10/2022 | 11/2022 | 12/2022 | 01/2023 | 02/2023 | 03/2023 | 04/2023 | 05/2023 | 06/2023 | 07/2023 | 08/2023 | 09/2023 | 10/2023 | 11/2023 | 12/2023 | 01/2024 | 02/2024 | 03/2024 | 04/2024 | 05/2024 | 06/2024 | 07/2024 | 08/2024 | 09/2024 | 10/2024 | 11/2024 | 12/2024 |
|---|---|---|---|---|---|---|---|---|---|---|---|---|---|---|---|---|---|---|---|---|---|---|---|---|---|---|---|---|---|---|---|---|---|---|---|---|---|---|---|---|---|---|---|---|---|---|---|---|---|---|---|---|---|---|---|---|---|---|---|---|---|---|---|---|---|---|---|---|---|---|---|---|---|---|---|---|---|---|---|---|---|---|---|---|
| New Home Average Price (left) | 5% | 6% | 5% | 5% | 5% | 6% | 7% | 8% | 9% | 10% | 10% | 11% | 11% | 11% | 11% | 11% | 11% | 11% | 10% | 9% | 9% | 8% | 7% | 7% | 6% | 6% | 5% | 5% | 5% | 5% | 5% | 5% | 5% | 4% | 4% | 4% | 4% | 4% | 4% | 4% | 4% | 4% | 4% | 4% | 3% | 3% | 2% | 2% | 2% | 1% | 1% | 0% | -1% | -1% | -2% | -2% | -2% | -2% | -2% | -2% | -2% | -2% | -1% | -1% | 0% | 0% | -1% | -1% | -1% | -1% | -1% | -1% | -1% | -2% | -3% | -4% | -4% | -5% | -5% | -6% | -6% | -6% | -6% | -6% |
| Existing Home Average Price (left) | 5% | 5% | 4% | 4% | 4% | 4% | 5% | 6% | 7% | 7% | 8% | 8% | 8% | 8% | 8% | 8% | 8% | 7% | 7% | 5% | 5% | 4% | 4% | 4% | 3% | 3% | 3% | 2% | 2% | 2% | 2% | 2% | 2% | 2% | 2% | 2% | 2% | 3% | 3% | 3% | 3% | 3% | 3% | 3% | 2% | 2% | 1% | 1% | 0% | 0% | -1% | -2% | -2% | -3% | -3% | -3% | -4% | -4% | -4% | -4% | -4% | -3% | -3% | -3% | -3% | -3% | -3% | -3% | -3% | -3% | -4% | -4% | -4% | -5% | -6% | -7% | -7% | -8% | -8% | -9% | -9% | -9% | -9% | -8% |
| Consumer Confidence Index (right) | 122 | 124 | 122 | 123 | 123 | 118 | 120 | 119 | 119 | 119 | 122 | 123 | 124 | 126 | 124 | 125 | 123 | 126 | 124 | 122 | 124 | 124 | 125 | 127 | 126 | 119 | 122 | 116 | 116 | 113 | 117 | 116 | 121 | 122 | 124 | 122 | 123 | 127 | 122 | 122 | 122 | 123 | 118 | 118 | 121 | 120 | 120 | 120 | 122 | 121 | 113 | 87 | 87 | 89 | 88 | 87 | 87 | 87 | 86 | 88 | 91 | 95 | 95 | 87 | 88 | 86 | 86 | 87 | 87 | 88 | 87 | 88 | 89 | 89 | 89 | 88 | 86 | 86 | 86 | 86 | 86 | 87 | 86 | 86 |
Source: National Bureau of Statistics via CEIC.
China's macroeconomic picture is somewhat bleak. But the macro picture isn't the full story.
Looking at specific industries, real estate's contraction is the outlier (Figure 6). Manufacturing value added grew faster than overall GDP last year. High-tech manufacturing, however, grew even faster, while IT and software-related services have outpaced GDP growth for years.
Figure 6: China's High-Tech Economy Outpacing Other Sectors
Percent change, year on year

| Year | 2018 | 2019 | 2020 | 2021 | 2022 | 2023 | 2024 |
|---|---|---|---|---|---|---|---|
| Real GDP | 6.8% | 6.1% | 2.3% | 8.6% | 3.1% | 5.4% | 5.0% |
| All Manufacturing | 6.1% | 4.1% | 2.0% | 10.7% | 1.2% | 3.9% | 6.0% |
| Construction | 4.8% | 5.2% | 2.7% | 1.1% | 2.9% | 7.1% | 3.8% |
| All Services | 8.0% | 7.6% | 2.4% | 9.0% | 3.5% | 6.3% | 5.0% |
| Real Estate | 4.0% | 3.2% | 1.9% | 4.1% | -3.0% | -0.7% | -1.8% |
| IT Services | 27.8% | 21.5% | 17.8% | 17.8% | 12.7% | 12.4% | 10.9% |
| High-Tech Manufacturing | 11.7% | 8.8% | 7.1% | 18.2% | 7.4% | 2.7% | 8.9% |
Source: National Bureau of Statistics via CEIC.
Note: All values are in real (inflation-adjusted) terms.
Fixed asset investment has grown the fastest among China's high-tech industries in recent years (Figure 7). Infrastructure investment has slowed largely because of strained local government finances, and real estate investment fell by 3.7 percent, bringing down overall investment.
Figure 7: Rapid Investment in China's High-Tech Industries
Fixed asset investment, compound annual growth rate (2019–2024)
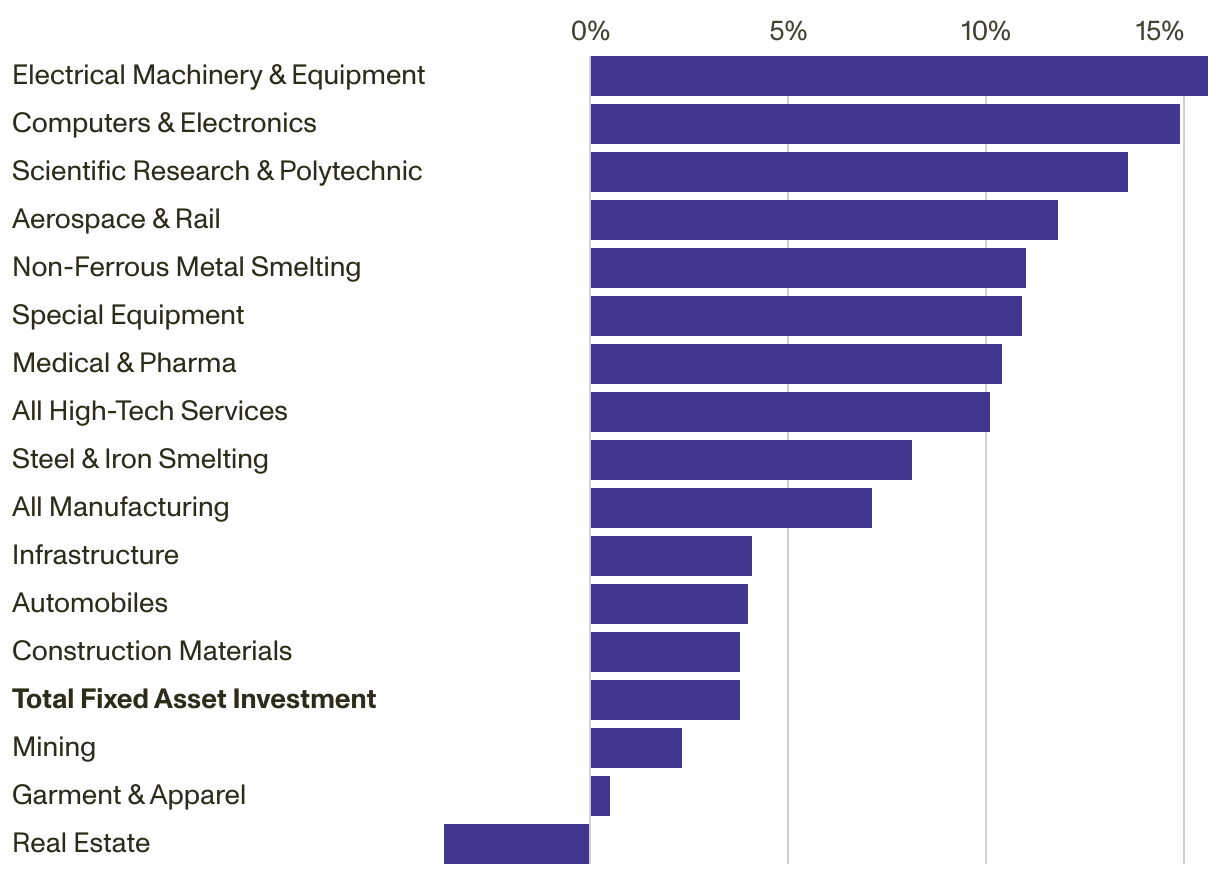
- Electrical Machinery & Equipment: 15.6%
- Computers & Electronics: 14.9%
- Scientific Research & Polytechnic: 13.6%
- Aerospace & Rail: 11.8%
- Non-Ferrous Metal Smelting: 11.0%
- Special Equipment: 10.9%
- Medical & Pharma: 10.4%
- All High-Tech Services: 10.1%
- Steel & Iron Smelting: 8.1%
- All Manufacturing: 7.1%
- Infrastructure: 4.1%
- Automobiles: 4.0%
- Construction Materials: 3.8%
- Total Fixed Asset Investment: 3.8%
- Mining: 2.3%
- Garment & Apparel: 0.5%
- Real Estate: -3.7%
Source: National Bureau of Statistics via CEIC.
With China's investment and production in high-tech industries growing and Beijing prioritizing techno-industrial policy, it should come as no surprise that China leads global exports of many high-tech goods (Figure 8). This includes the so-called “new trio” (electric vehicles, lithium-ion batteries, and solar panels) as well as critical minerals, to which Beijing has suggested it will apply export controls, probably partly to discourage Washington from increasing its tariffs and export controls aimed at China.
Figure 8: China Leads Global Exports of Many High-Tech Goods
China share of Global Exports by Value, 2023
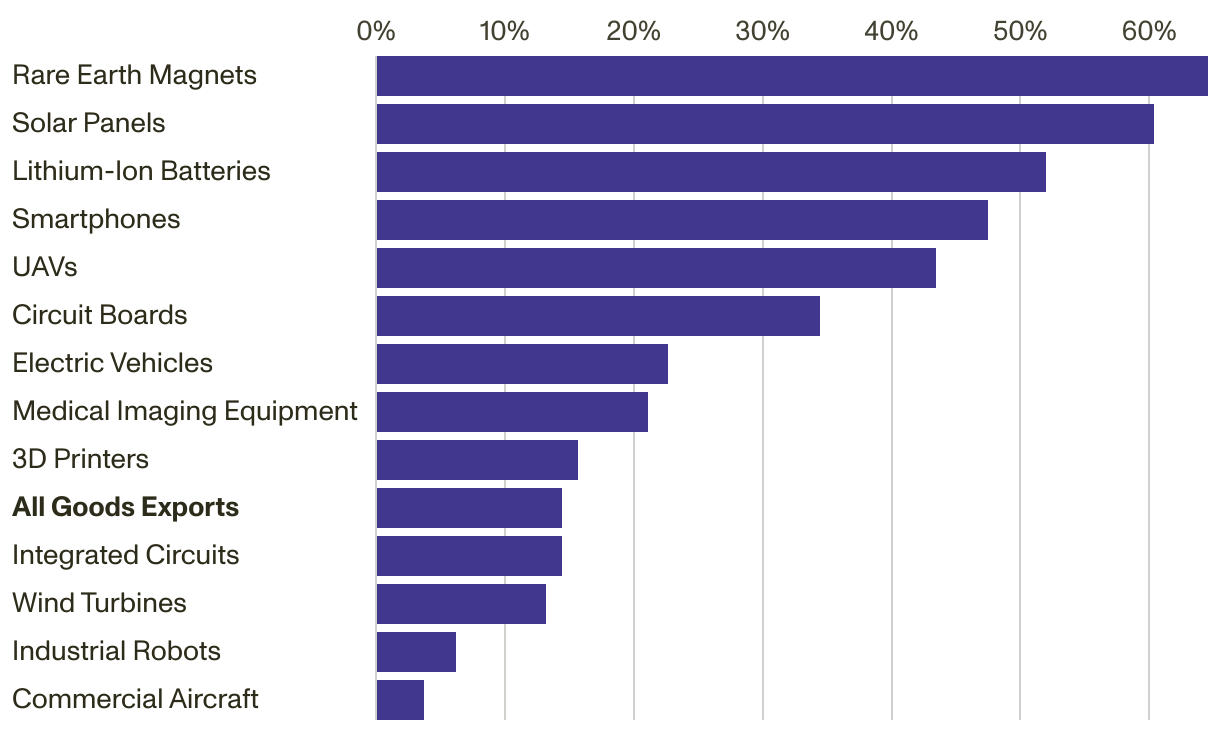
- Rare Earth Magnets: 64.5%
- Solar Panels: 60.3%
- Lithium-Ion Batteries: 51.9%
- Smartphones: 47.4%
- UAVs: 43.4%
- Circuit Boards: 34.4%
- Electric Vehicles: 22.6%
- Medical Imaging Equipment: 21.0%
- 3D Printers: 15.6%
- All Goods Exports: 14.3%
- Integrated Circuits: 14.3%
- Wind Turbines: 13.1%
- Industrial Robots: 6.2%
- Commercial Aircraft: 3.6%
Source: International Trade Centre.
Note: HS code categories: 3D printers (847759); circuit boards (8534); commercial aircraft (880240); electric vehicles (870380); industrial robots (847950); integrated circuits (8542); lithium-ion batteries (850760); medical imaging equipment (901812); rare earth magnets (850511); smartphones (851713); solar panels (854143); UAVs (8806); and wind turbines (850231).
The key to reconciling the narratives of a macro slowdown with rising tech prowess is to understand that the high-tech industries are a small share of China's overall economy. China's National Bureau of Statistics estimates the size of the “new economy,” which includes but isn't limited to high-tech industries. By that metric, the “new economy” is less than 20 percent of GDP and has accounted for a little more than 20 percent of growth in recent years (Figure 9).
Or consider the case of automobiles. The production of cars, their parts, motors, and batteries for electric vehicles contributed 1.7 percent of national value added in 2020, the latest data available. Total sales of automobiles, including China's rapidly growing electric vehicle industry, have equaled 3.7 percent of GDP for five years in a row, as new-energy vehicles overtake traditional cars. But the fact is that China's auto sector isn't much larger, if at all, today as a share of the economy than it was five years ago.
Figure 9: China's New Economy Contributes Less to Growth Than the Old Economy
Percentage points, year on year

| Year | 2017 | 2018 | 2019 | 2020 | 2021 | 2022 | 2023 | 2024 |
|---|---|---|---|---|---|---|---|---|
| Nominal GDP Growth | 11.3% | 10.5% | 7.5% | 2.9% | 13.4% | 5.1% | 4.9% | 4.2% |
| New Economy | 2.10% | 2.19% | 1.48% | 0.73% | 2.71% | 1.09% | 1.09% | 1.01% |
| Old Economy | 9.2% | 8.3% | 6.0% | 2.2% | 10.7% | 4.0% | 3.8% | 3.2% |
Source: National Bureau of Statistics via CEIC.
Note: “New economy” as defined by the National Bureau of Statistics' “three new” activities value added from new industry, new business, and new business models. “New economy” value added estimated for 2024 based on the 2021–23 trend.
A corollary to high-tech industries being small relative to China's economy is that they're also small as a share of China's rising trade surplus (Figure 10). In gross export terms, high-tech goods averaged about 26 percent of China's total exports from 2022 to 2024 despite the country's wider export surge. Some Western governments are concerned about reliance on China for technologies such as electric vehicles or batteries, but overall, the world relies on China more for low- or medium-tech goods than for high-tech goods.
Figure 10: High-Tech Goods Are Small Share of China's Trade Surplus
Currency is in current U.S. dollars

| Year | 2000 | 2001 | 2002 | 2003 | 2004 | 2005 | 2006 | 2007 | 2008 | 2009 | 2010 | 2011 | 2012 | 2013 | 2014 | 2015 | 2016 | 2017 | 2018 | 2019 | 2020 | 2021 | 2022 | 2023 | 2024 |
|---|---|---|---|---|---|---|---|---|---|---|---|---|---|---|---|---|---|---|---|---|---|---|---|---|---|
| High-Tech Goods | -15.5 | -17.4 | -15.0 | -9.1 | 4.4 | 20.7 | 34.2 | 60.0 | 73.7 | 66.9 | 79.8 | 85.6 | 94.6 | 102.8 | 108.4 | 107.4 | 81.6 | 82.5 | 74.3 | 88.7 | 91.7 | 145.5 | 205.1 | 196.6 | 170.5 |
| Other Manufactured Goods | 60.9 | 59.8 | 66.2 | 72.5 | 105.1 | 180.1 | 277.3 | 383.1 | 506.8 | 355.6 | 454.6 | 573.6 | 671.1 | 708.2 | 807.9 | 863.8 | 797.7 | 811.9 | 857.5 | 932.0 | 1007.1 | 1370.1 | 1599.0 | 1581.5 | 1720.6 |
| Primary Goods | -21.3 | -19.3 | -20.8 | -38.0 | -76.7 | -98.7 | -134.0 | -181.1 | -283.5 | -224.3 | -349.8 | -501.4 | -532.9 | -549.6 | -536.1 | -369.5 | -332.1 | -456.5 | -563.9 | -591.3 | -561.3 | -826.2 | -915.1 | -919.5 | -898.0 |
| Trade Balance as % GDP | 2.0% | 1.7% | 2.0% | 1.5% | 1.7% | 4.4% | 6.3% | 7.2% | 6.3% | 3.8% | 3.0% | 2.0% | 2.7% | 2.7% | 3.6% | 5.4% | 4.8% | 3.5% | 2.6% | 3.0% | 3.6% | 3.8% | 4.9% | 4.7% | 5.3% |
Source: General Administration of Customs via CEIC.
Note: High-tech goods include advanced materials, aerospace, biotechnology, computer integrated manufacturing, computers and telecommunication, electric vehicles, electronics, life science technology, opto-electronics, and other technologies.
China's economy and its high-tech industries are still linked, of course. A stronger economy means increased demand, bigger profits, greater research and development, larger resources for techno-industrial policy, and more firms in emerging sectors like AI. China's economy may look a bit better this year, with tenuous indications of property market stabilization and Beijing promising support for domestic consumption.
But even if overall economic growth remains comparatively weak and many Chinese firms continue to struggle, China's central and local governments will keep supporting high-tech industries and emerging stars like DeepSeek. Xi's priorities are clear, and fiscal constraints—especially for localities—are not yet strong enough to curtail support to high-tech firms. That means that Western policymakers shouldn't make the mistake of believing China is down and out, and they shouldn't be surprised when China continues to catch up or make breakthroughs in critical and emerging technologies. Investors in China's financial markets are evidently starting to share that view.
For now, at least, China's enormous and competitive domestic market combined with nurturing technological and industrial policies may be enough to achieve Xi's goals and spark more “Sputnik moments” in the West.


